ConGen Africa

GENETIC MANAGEMENT GUIDELINES

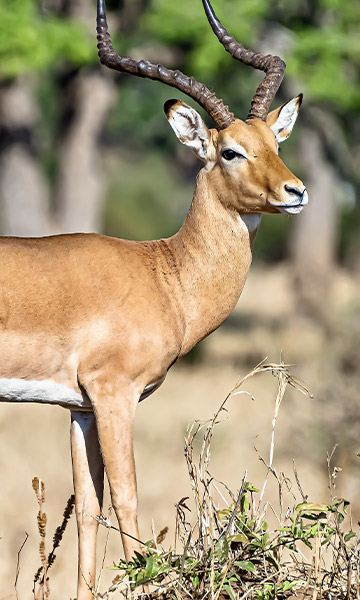
Impala Aepyceros melampus

A single species of impala Aepyceros melampus (Lichtenstein, 1812), the sole extant member of the Aepycerotini, is currently recognised across the broad geographic distribution in southern and East Africa. In the past up to six subspecies were proposed (Ansell 1972), yet at present conservation authorities only accept two subspecies, the common impala A. m. melampus (Lichtenstein, 1812) in southern and East Africa, and the vulnerable black-faced impala A. m. petersi (Bocage, 1879) restricted to north-western Namibia and south-western Angola. These subspecies are used for permitting purposes in southern Africa. Genetics research, including recent genome-level analyses, support at least three subspecies that are herein treated as Evolutionarily Significant Units (ESUs, Figure 1). There are at least five Genetic Management Units (GMUs, Figure 1), although additional priority research should refine the status and guidelines for these units.
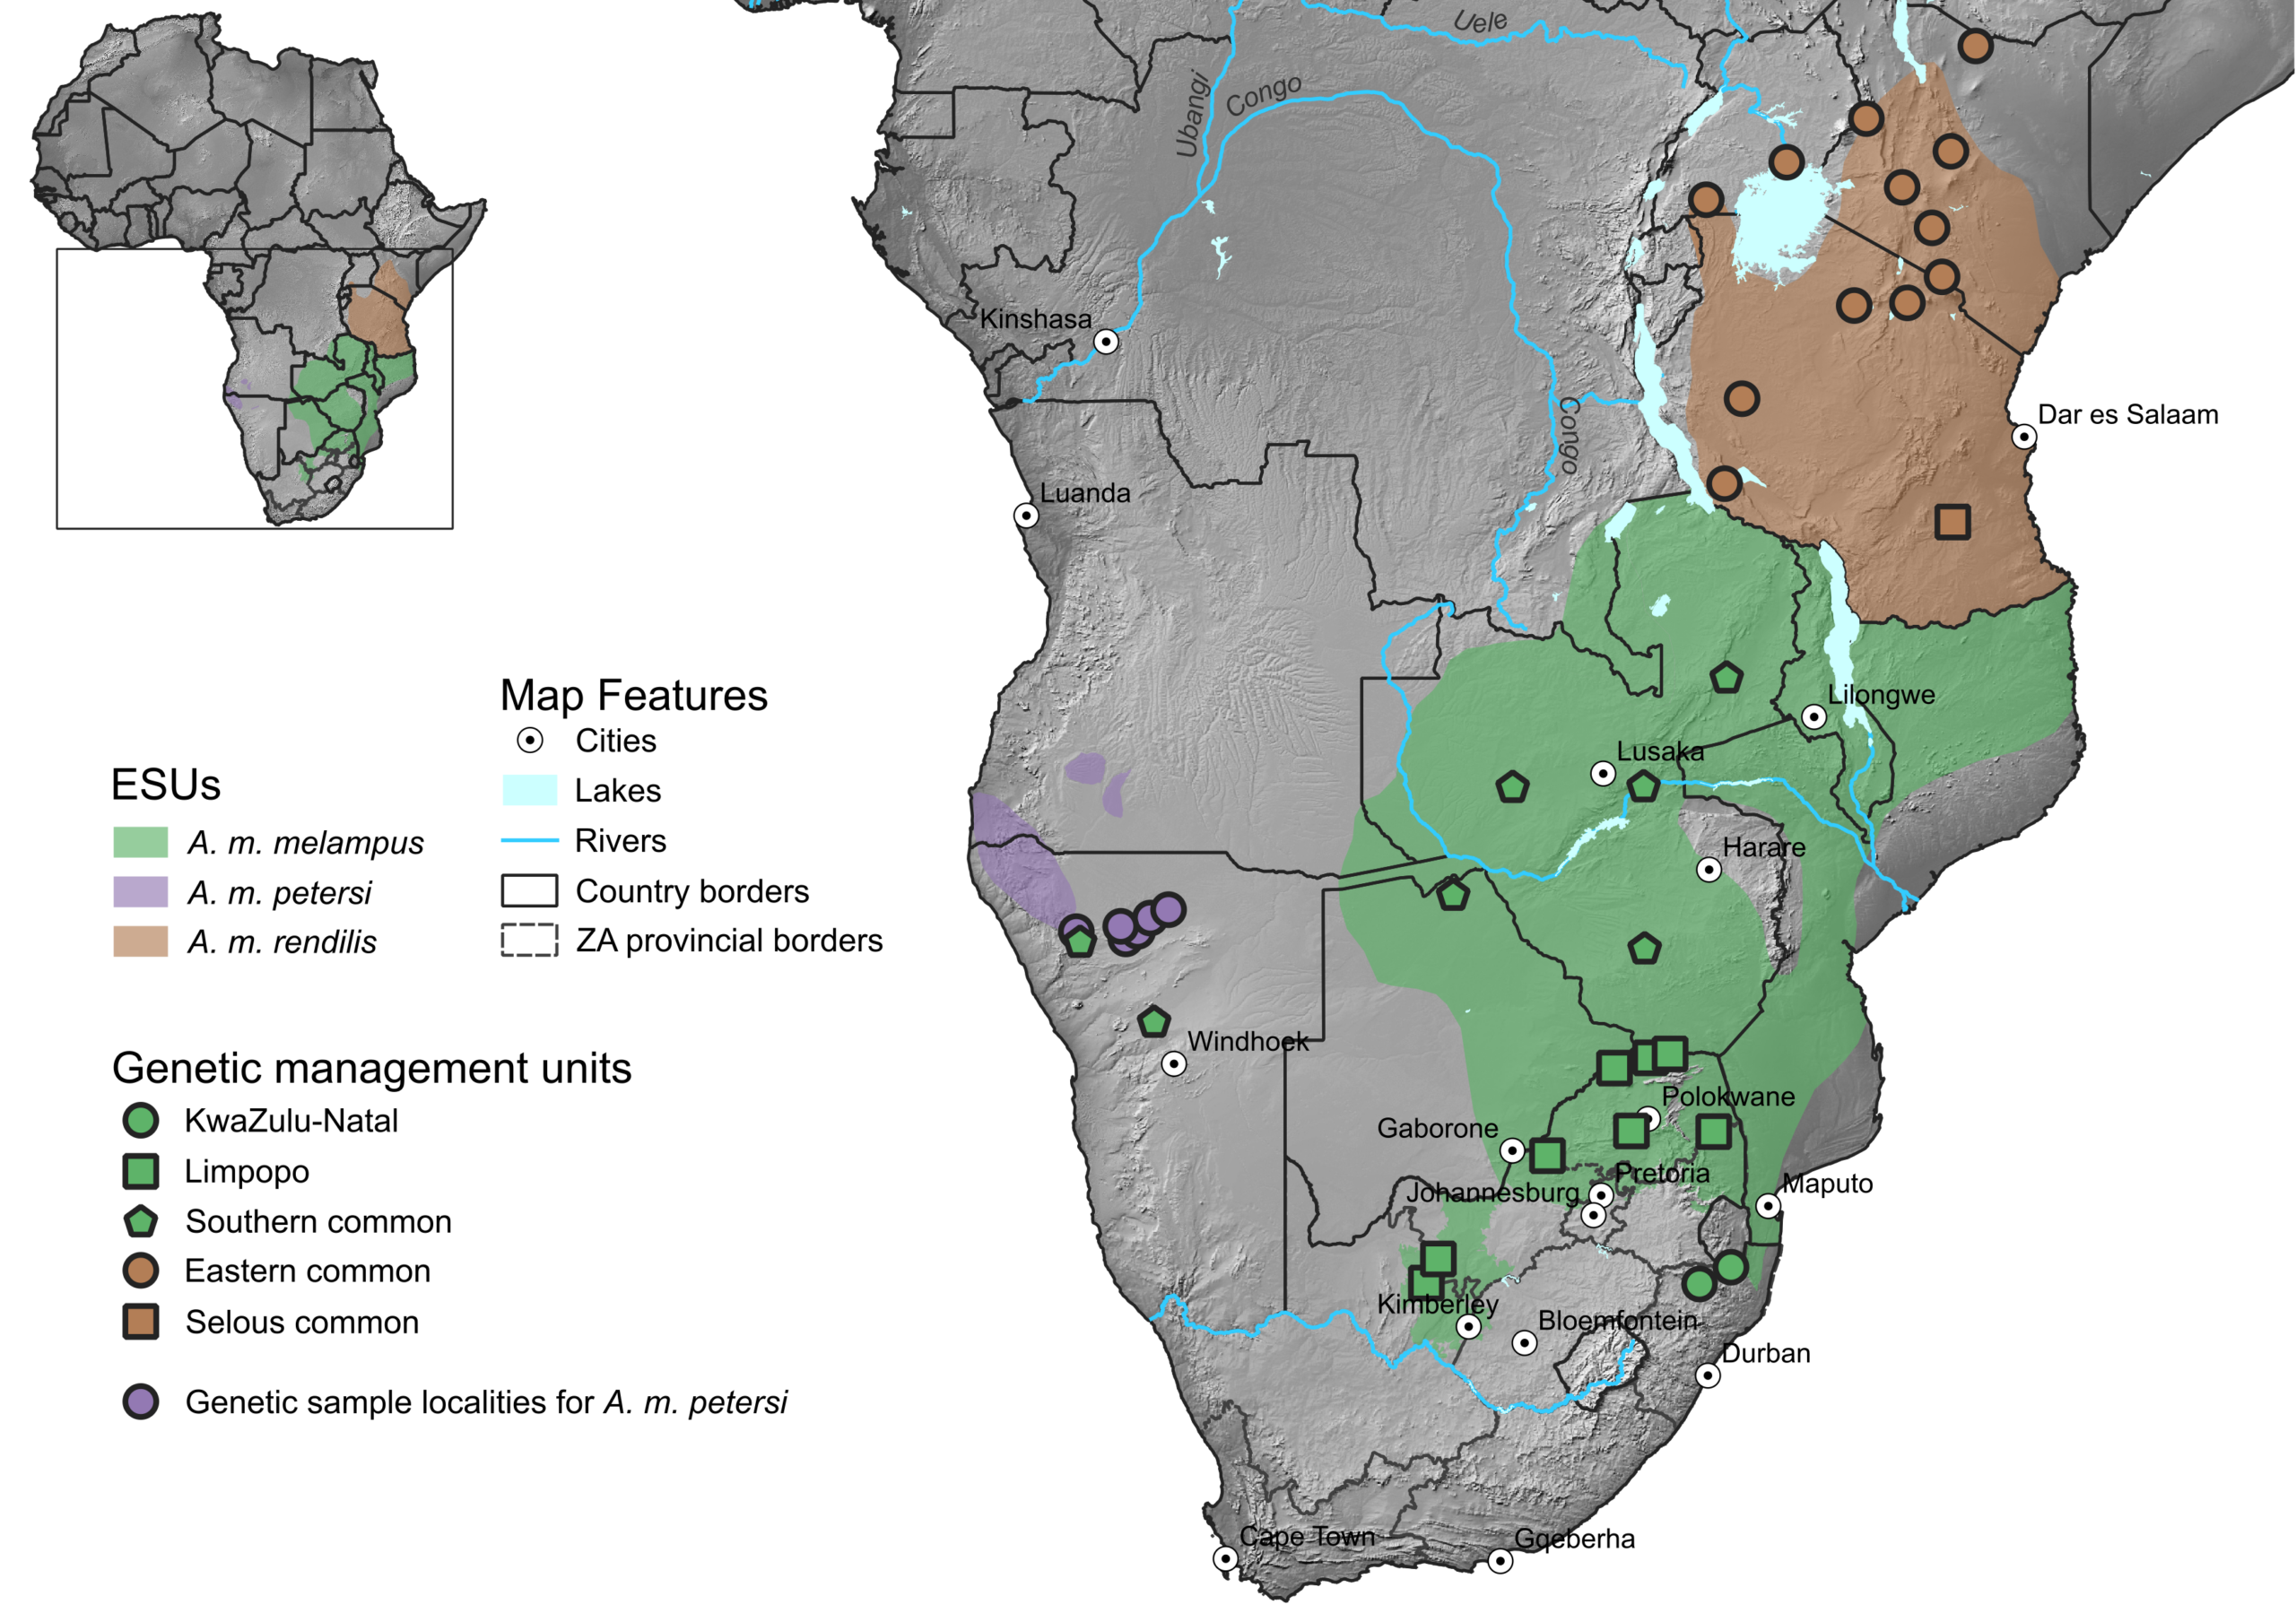

Figure 1: Natural distribution of impala (Aepyceros melampus) subspecies indicated by different colours. Genetic Management Units (GMUs) are indicated by different symbols, with the colour corresponding to the ESU to which it belongs. Each point represents a locality which has been sampled for genetic data and thus the GMU (symbol) and ESU (colour) designation of each locality is based on genetic data. Note that the points in and near Etosha National Park have been slightly adjusted so that all points are visible. The inset indicates the part of Africa shown in the main map. Distribution data sources: South Africa – Birss, C., Rushworth, I., Collins, N. B., Peinke, D. & Buijs, D. 2017. Inferred natural distribution ranges of certain large mammals in South Africa. Unpublished GIS coverage. Rest of Africa – IUCN (International Union for Conservation of Nature) 2016. Aepyceros melampus. The IUCN Red List of Threatened Species. Version 2021-1. https://www.iucnredlist.org.

Management Level

Subspecies

Three subspecies of impala are recognised across Africa based on genetic and morphological data (Frost 2014, Garcia-Erill et al. 2024), although some sources only recognise the black-faced and common impala (Selier et al. 2016).

  • Aepyceros melampus petersi (black-faced impala)
  • Aepyceros melampus melampus (common or southern impala)
  • Aepyceros melampus rendilis (East African impala)

The guidelines provided in this document are based on genetic data, which confirms that the subspecies are equivalent to Evolutionarily Significant Units (ESUs).

Evolutionarily Significant Units (ESUs)

See under Subspecies heading above.

Genetic Management Units (GMUs)
  • Black-faced impala
    • No GMUs recognised at present but see Priority research
  • Common or southern impala
    • KwaZulu-Natal (KZN)
    • Limpopo (LP)
    • Southern common (SO)
  • East African impala
    • Selous common (SE) 
    • Eastern common (EA)

Management boundaries

See Figure 1 for visual representation and figure legend for more detail.
Subspecies
  • Aepyceros melampus petersi: North-western Namibia and south-western Angola.
  • Aepyceros melampus melampus: South Africa, eSwatini, north-eastern Namibia (Zambezi Region – previously Caprivi Strip), south-eastern Angola, Botswana, Zimbabwe, Mozambique, Zambia, southern Democratic Republic of the Congo, Malawi.
  • Aepyceros melampus rendilis: Tanzania, Kenya, Uganda, Rwanda, Burundi (possibly extinct).
  •  
Genetic Management Units (GMUs)
  • Common or southern impala
    • KwaZulu-Natal (KZN): northern KwaZulu-Natal Province of South Africa.
    • Limpopo (LP): Limpopo Province of South Africa.
    • Southern common (SO): north-eastern Namibia, Botswana, Zimbabwe, Zambia. 
  • East African impala
    • Eastern common (EA): Western Tanzania, Kenya and Uganda.
    • Selous common (SE): Selous Nature Reserve (now Nyerere National Park), Tanzania.

Genetic Risk

  • Global population Nc: 2,000,000 (IUCN 2016; East 1999).
  • South African population Nc: 540,936-631,092 (East 1999).
  • Genetic indicators are calculated at GMU level. This is based on a best case scenario where gene flow is maintained within GMUs.
  • If values are reported as a range, the average is used for subsequent calculations.
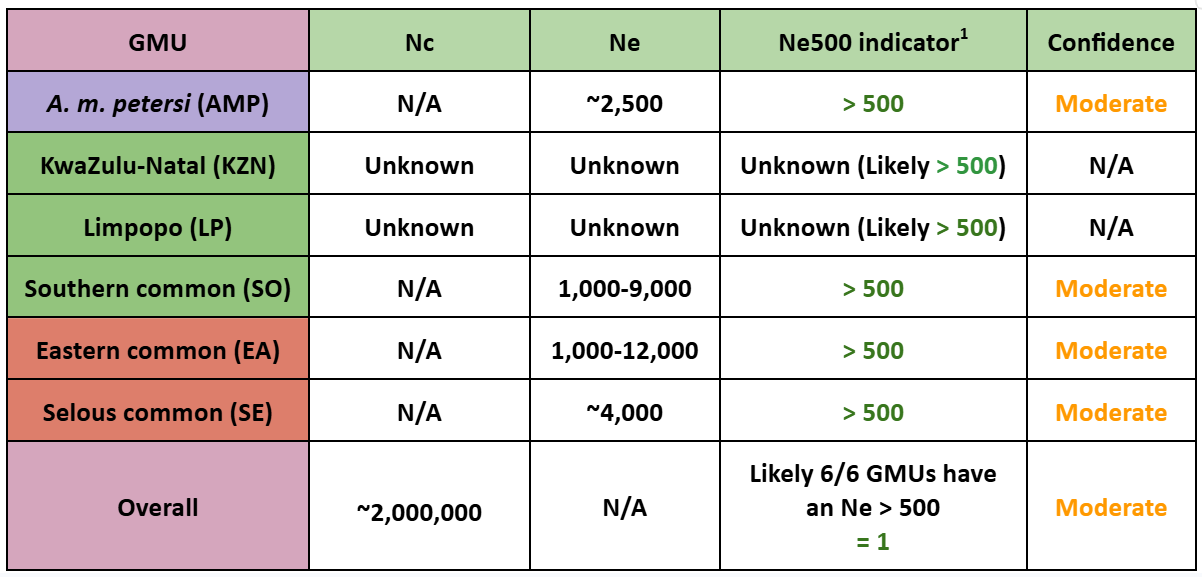
Table 1. Effective population size, Ne500 indicator, and confidence in the values calculated per GMU for impala. Colour of the GMU label is linked to the colour used in Figure 1. Colour of Ne500 and confidence text corresponds to positive (green) or negative  interpretation (orange/red). Overall Ne500 indicates the proportion of the total GMUs that have an Ne over 500.
Genetic Indicators
  • Ne500 indicator1
    • A. m. petersi (AMP) Ne was based on genetic data from Garcia-Erill et al. 2024. For comparative context, Nc: 3,000-4,000 (IUCN 2017). Using an Nc:Ne ratio of 0.1-0.3, Ne = 350-1,050.
    • South Africa:
      • KwaZulu-Natal (KZN) and Limpopo (LP) individuals: 901,560 (East 1999). Both GMUs are reported to have sufficient population sizes to meet the Ne > 500 threshold (Shrader and da Silva 2025). 
    • Southern common (SO) Ne was based on genetic data from Garcia-Erill et al. 2024. For comparative context, individuals: 449,750 (East 1999).  With assumed maturity percentage of 60-70 % (Shrader and da Silva 2025), Nc: 269,850-314,825.
    • Eastern common (EA) Ne was based on genetic data from Garcia-Erill et al. 2024. For comparative context, individuals: 203,800 (East 1999). With assumed maturity percentage of 60-70 % (Shrader and da Silva 2025), Nc: 122,280-142,660. 
    • Selous common (SE) Ne was based on genetic data from Garcia-Erill et al. 2024. For comparative context, individuals: 29,500 (UNESCO 2011). With assumed maturity percentage of 60-70 % (Shrader and da Silva 2025), Nc: 17,713-20,665.

Of the six genetic management units, four have an Ne above 500 based on genetic data, and two are assumed to have an Ne above 500 based on comments on abundance within their ranges and population data for the country in which they occur. Ne > 500 indicates each GMU will maintain genetic diversity, assuming gene flow is maintained within GMUs, thus indicating lower genetic risk.

 
  • Proportion of populations maintained (PM2):
    • The global populations of impala comprise six GMUs, therefore the proportion of populations maintained globally: 6/6 = 1.
  •  
Diversity Loss
  • Functional variation: There is moderate risk of functional variation loss in impala due to their large population size and wide distribution, yet isolated populations exist in fenced areas therefore localised loss is a potential concern. Levels of genetic diversity are low in isolated groups and groups subjected to intensive and selective breeding (Grobler & Van der Bank 1994, Lorenzen et al. 2006, Garcia-Erill et al. 2024).
  • Divergent lineages: There is a moderate risk of losing divergent lineages as the subspecies A. m. petersi occurs at lower densities and is more geographically restricted than A. m. melampus or A. m. rendilis (Lorenzen et al 2006; Grobler et al. 2011). 
Hybridisation/introgression
  • There is evidence of hybridisation and introgression between impala subspecies, with A. m. melampus being moved into areas historically occupied by A. m. petersi in southern Africa by human-mediated translocation for game ranching and hunting (Nersting and Arctander 2001; Lorenzen and Siegismund 2004; Lorenzen et al. 2006; Miller et al. 2020). This hybridisation is a particular threat to A. m. petersi as it is less widespread (Grobler et al. 2011).
Lower turnover/constraints on adaptive opportunities
  • Lower levels of genetic diversity have been detected in the black-faced impala and East African impala compared with the common or southern impala (Nersting and Arctander 2001; Lorenzen and Siegismund 2004; Lorenzen et al. 2006; Miller et al. 2020; Garcia-Erill et al. 2024). Adaptive opportunities may be constrained locally in fenced or intensively managed populations, especially alongside pressures such as changing climate.
In situ genetic threat level
  • In situ risk (Moderate)
    Impala remain abundant and genetically diverse across the majority of their range. However, when assessed at the subspecies level, risks increase due to lineage mixing, habitat fragmentation, and uneven management practices, especially affecting A. m. petersi. Continued unregulated translocations may elevate long-term genetic risk despite stable census numbers. For more threats, see the IUCN Red List assessments for impala as a species, common impala and black-faced impala and the South African Red List for common impala.
 
  • Confidence in in situ threat level
    • Confidence score (Moderate)

Confidence is moderate as the assessment is based on IUCN or regional assessment  data from within the last decade (IUCN 2016; IUCN 2017; Shrader and da Silva 2025). However, population numbers for some GMUs to calculate Ne500 were assumed from data provided in East (1999) as well as the South African red list assessment (Shrader and da Silva 2025), IUCN assessments (IUCN 2017), and UNESCO data sheets (UNESCO 2011). The in situ risk score is based on several assumptions and could potentially misrepresent current population census sizes. Confidence is supported by mitochondrial and nuclear genetic studies demonstrating high diversity but clear subspecies structure (Lorenzen et al. 2006; Grobler et al. 2011).
Ex situ representation
  • Impala are present in private game reserves, wildlife ranches, and managed conservation areas rather than traditional zoo breeding programs.
  • Several colour variants of common impala (e.g. black and saddle-back) are routinely bred on private wildlife ranches in the region. Escapees from such ranches threaten the genetic integrity of natural populations.
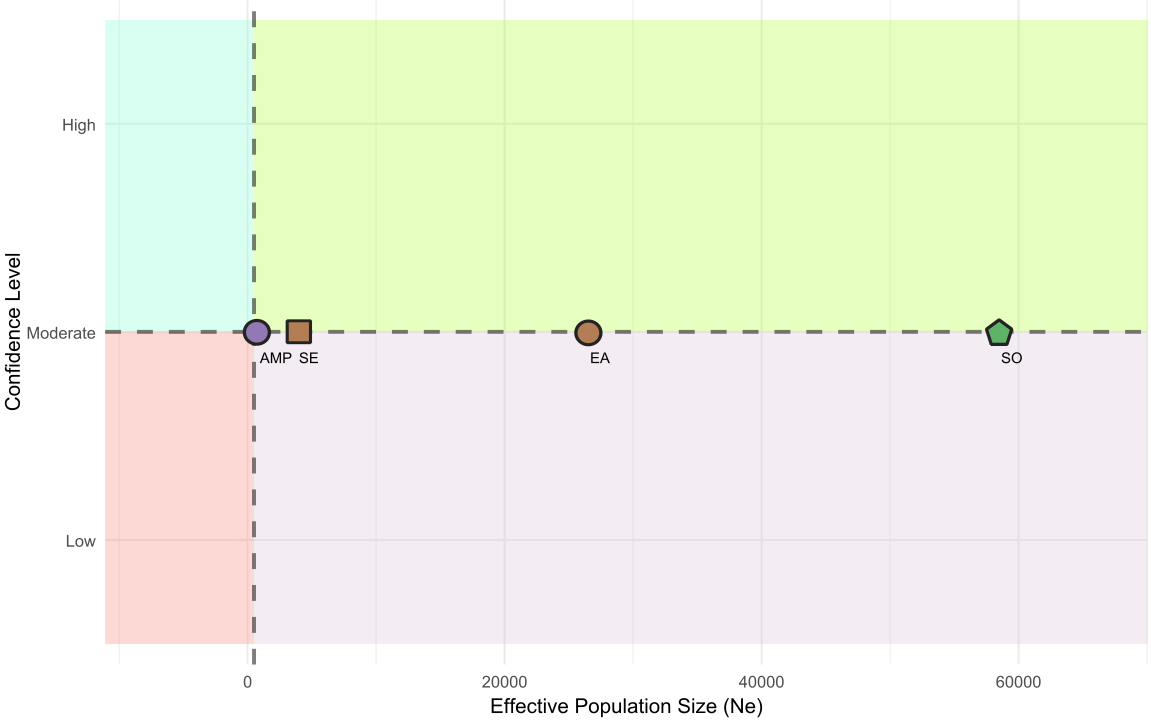
Figure 2. Effective population size compared to confidence in the value. Colour and shape of points and labelling corresponds to the GMU in Figure 1 and Table 1. Dashed lines divide the x axis into above and below Ne500, and the y axis into low and high confidence. GMUs in the low confidence quadrant should be further surveyed to increase confidence in the evaluation. Those with high confidence below Ne500 should have increased genetic management. Note that the KZN and LP GMUs are not shown due data deficiency.

1 Proportion of populations within species with an effective population size (Ne) greater than 500
(https://www.gbf-indicators.org/metadata/headline/A-4)

2 Proportion of populations maintained within species
(https://ccgenetics.github.io/guidelines-genetic-diversity-indicators/docs/2_Theoretical_background/PM-indicator.html)

Management Guidelines

  • No mixing of the three subspecies on the same property.
  • No new introductions of one subspecies into the range of the other subspecies. 
  • Black-faced impala 
    • Genetic testing is required to ensure that only pure black-faced impala is present in a population. The buffer zone in Namibia is crucial for the genetic integrity of the vulnerable subspecies (Matson 2006, Miller et al. 2020).
  • Common or southern impala 
    • No translocations between GMUs but allow natural migration.
  • East African impala
    • No translocations between GMUs but allow natural migration.
  • All GMUs are indicated to have an Ne > 500 under the assumption of gene flow within GMUs. Therefore, management must strive to facilitate natural migration and gene flow between isolated populations within each GMU, while taking cognisance of the other guidelines above.

IUCN Status:

  • Global: Vulnerable (indicated below).
  • South Africa: Least concern. 

Limitations & Assumptions

  • Genetic evaluation for any South African impala populations outside of KZN and Limpopo has not been carried out (Schwab et al. 2012). The latter study did an analysis including mitochondrial DNA sequences from previous studies (Nersting & Arctander 2001, Lorenzen et al. 2006) but re-analysis and interpretation is required (See Priority research). 
  • Previous studies did not include samples from South Africa (Nersting & Arctander 2001, Lorenzen et al. 2006, Garcia-Erill et al. 2024), thus the relationships of the Limpopo GMU and KwaZulu-Natal GMU (Schwab et al. 2012) within the broader Southern common (SO) group need further investigation.
  • Several studies reported isolated populations and lower levels of adaptability in East Africa (Nersting & Arctander 2001, Lorenzen et al. 2006, Garcia-Erill et al. 2024). The assessment of GMU status based on wider sampling is required.
  • Parts of the species distributional range are data deficient and therefore difficult to assign ESU/GMU status. The status of eSwatini, southern Angola, Mozambique, Malawi, Rwanda and Burundi populations with respect to ESUs and GMUs should be determined. There are suggestions that the species is extinct in Burundi.

Priority Research

  • More populations of black-faced impala must be sampled across Namibia and Angola (currently no data) to investigate the levels of genetic diversity, inbreeding in the subspecies, and genetic substructure across its distribution, to determine if GMUs are present. Lorenzen et al. (2006) suggested some differentiation among sites in Etosha National Park. 
  • The consequences of subspecies hybridisation should be investigated.
  • More extensive sampling of impala in natural populations in South Africa and Mozambique outside of Limpopo Province and KZN, in order to conduct a finer scale phylogeographic study of this region. 
  • More extensive sampling of impala in Central and East Africa given the sampling gaps and findings of previous studies (Nersting & Arctander 2001, Lorenzen et al. 2006, Garcia-Erill et al. 2024) and to refine the distribution of the East African subspecies/ESU A. m. rendilis.

Cited References

  • Ansell, W.F.H. (1972) Family Artiodactyla. In: J. Meester & H.W. Setzer (eds). The Mammals of Africa: An Identification Manual, Part 2 15, pp, 1-84, Smithsonian Institution Press, Washington D.C.
  • Frost, W. 2014. The Antelope of Africa. T. Carnaby (ed), Jacana Media, Auckland Park, South Africa. pp. 184-188.
  • Garcia-Erill, G. et al. (2024) Extensive population structure highlights an apparent paradox of stasis in the impala (Aepyceros melampus). Molecular Ecology 33, e17539. doi.org/10.1111/mec.17539.
  • Grobler, J.P. and Van der Bank, F.H. (1994) Isozyme variation in South African impala (Aepyceros melampus) populations under different management regimes.  South African Journal of Wildlife Research 24B(4), 89-94. https://journals.co.za/doi/pdf/10.10520/EJC116956.
  • Lorenzen, E.D. et al. (2006). Regional genetic structuring and evolutionary history of the impala Aepyceros melampus. Journal of Heredity 97(2), 119-132. doi.org/10.1093/jhered/esj012.
  • Lorenzen, E.D. and Siegismund, H.R. (2004). No suggestion of hybridization between the vulnerable black-faced impala (Aepyceros melampus petersi) and the common impala (A. m. melampus) in Etosha National Park, Namibia. Molecular Ecology 13(10), 3007-3019. doi.org/10.1111/j.1365-294X.2004.02308.x
  • Matson, T.K. (2006). Future management of the black-faced impala in Namibia: A co-operative, multi-pronged approach to the conservation of a vulnerable subspecies. Ecological Journal 7, 96-98.  http://the-eis.com/elibrary/sites/default/files/downloads/literature/Matson.pdf
  • Miller, S. M. et al. (2020). Anthropogenic movement results in hybridisation in impala in southern Africa. Conservation Genetics 21(4), 653-663. doi.org/10.1007/s10592-020-01276-4.
  • Nersting, L.G. & Arctander, P. (2001). Phylogeography and conservation of impala and greater kudu. Molecular Ecology 10(3), 711-719. doi.org/10.1046/j.1365-294x.2001.01205.x.
  • Schwab, P. et al. (2012). Genetic structure of the common impala (Aepyceros melampus melampus) in South Africa: Phylogeography and implications for conservation. Journal of Zoological Systematics and Evolutionary Research 50(1), 76-84. doi.org/10.1111/j.1439-0469.2011.00638.x.
  • Selier, S.A.J. et al. (2016). A conservation assessment of Aepyceros melampus melampus. In Child MF, Roxburgh L, Do Linh San E, Raimondo D, Davies-Mostert HT, editors. The Red List of Mammals of South Africa, Swaziland and Lesotho. South African National Biodiversity Institute and Endangered Wildlife Trust, South Africa.
  • Shrader, A.M. and da Silva, J.M. (2025). A conservation assessment of Aepyceros melampus. In Patel T, Smith C, Roxburgh L, da Silva JM & Raimondo D, editors. The Red List of Mammals of South Africa, Eswatini and Lesotho. South African National Biodiversity Institute and Endangered Wildlife Trust, South Africa.

Consultation

Acknowledgements

We are grateful to Prof Paul Grobler and Dr Susan Miller for their valuable comments and for taking the necessary time and effort to critically review the initial guidelines.

Queries

If you have any additional questions related to these guidelines, please contact ConGen Africa at info@congenafrica.com.

Explore other species