ConGen Africa

GENETIC MANAGEMENT GUIDELINES

African buffalo Syncerus caffer

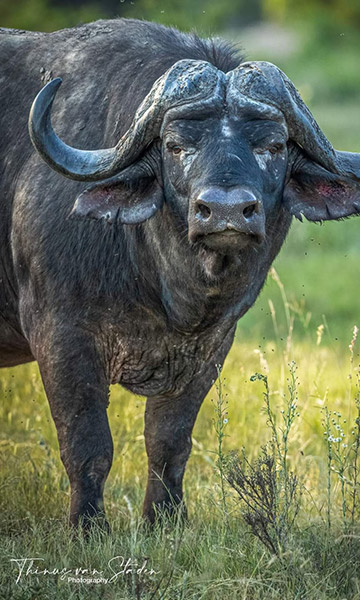
Within S. caffer, four subspecies have generally been accepted based on morphological characteristics, namely S. c. caffer (Cape or Savannah buffalo – large, blackish, large horns), S. c. nanus (forest or dwarf buffalo – small, reddish/brown, small horns), S. c. brachyceros (Sudan buffalo – intermediate size and colour compared to Cape and forest buffalo), and S. c. aequinoctialis (Nile buffalo – intermediate size and colour compared to Cape and forest buffalo) (see Smitz et al. 2013 for a summary of morphological differences). However, genetic studies show support for only two lineages: a West-Central lineage consisting of forest, Sudan, and Nile buffalo (S. c. nanus, S. c. brachyceros, and S. c. aequinoctialis) and South-East lineage consisting of Cape buffalo (S. c. caffer) (van Hooft et al. 2002, Smitz et al. 2013, Talenti et al. 2024). While there is some shared genetic variation between these two lineages, this current assessment has defined them as two distinct Evolutionarily Significant Units (ESUs) – the West-Central (WC) ESU and South-East (SE) ESU. This is based on the combined evidence of: (i) high genetic differentiation between the two lineages/ESUs (FCT mitochondrial DNA = 0.42 – 0.48 (van Hooft et al. 2002, Smitz et al. 2013), mean FST genome-wide data = 0.13 (Talenti et al. 2024)), (ii) distinct number of chromosomes (2n = 52 for Cape buffalo and 2n = 54 for forest buffalo (Wurster & Benirschke, 1968)), (iii) substantial morphological differences, and (iv) different preferred habitats of the WC ESU and SE ESU buffalo. 

The main evolutionary driving force of genetic differentiation in Cape buffalo (SE ESU, S. c. caffer) is isolation-by-distance (Simonsen et al. 1998, van Hooft et al. 2000, van Hooft et al. 2002, Talenti et al. 2024), with some exceptions (see Appendix). Within the SE ESU, there are several populations currently known to be threatened by inbreeding due to past bottlenecks and subsequent isolation: Addo Elephant National Park (NP) and Hluhluwe-iMfolozi Park in South Africa (O’Ryan et al. 1998, Smitz et al. 2014, de Jager et al. 2020, de Jager et al. 2021, Quinn et al. 2023, Talenti et al. 2024), and Catuane, Namaacha, Marromeu National Reserve, and Gorongosa NP in Mozambique (Colangelo et al. 2024). These populations require urgent genetic supplementation and highlight the vulnerability of Cape buffalo populations to genetic threats as a result of isolation from other populations. The WC ESU requires more in-depth genetic studies. 
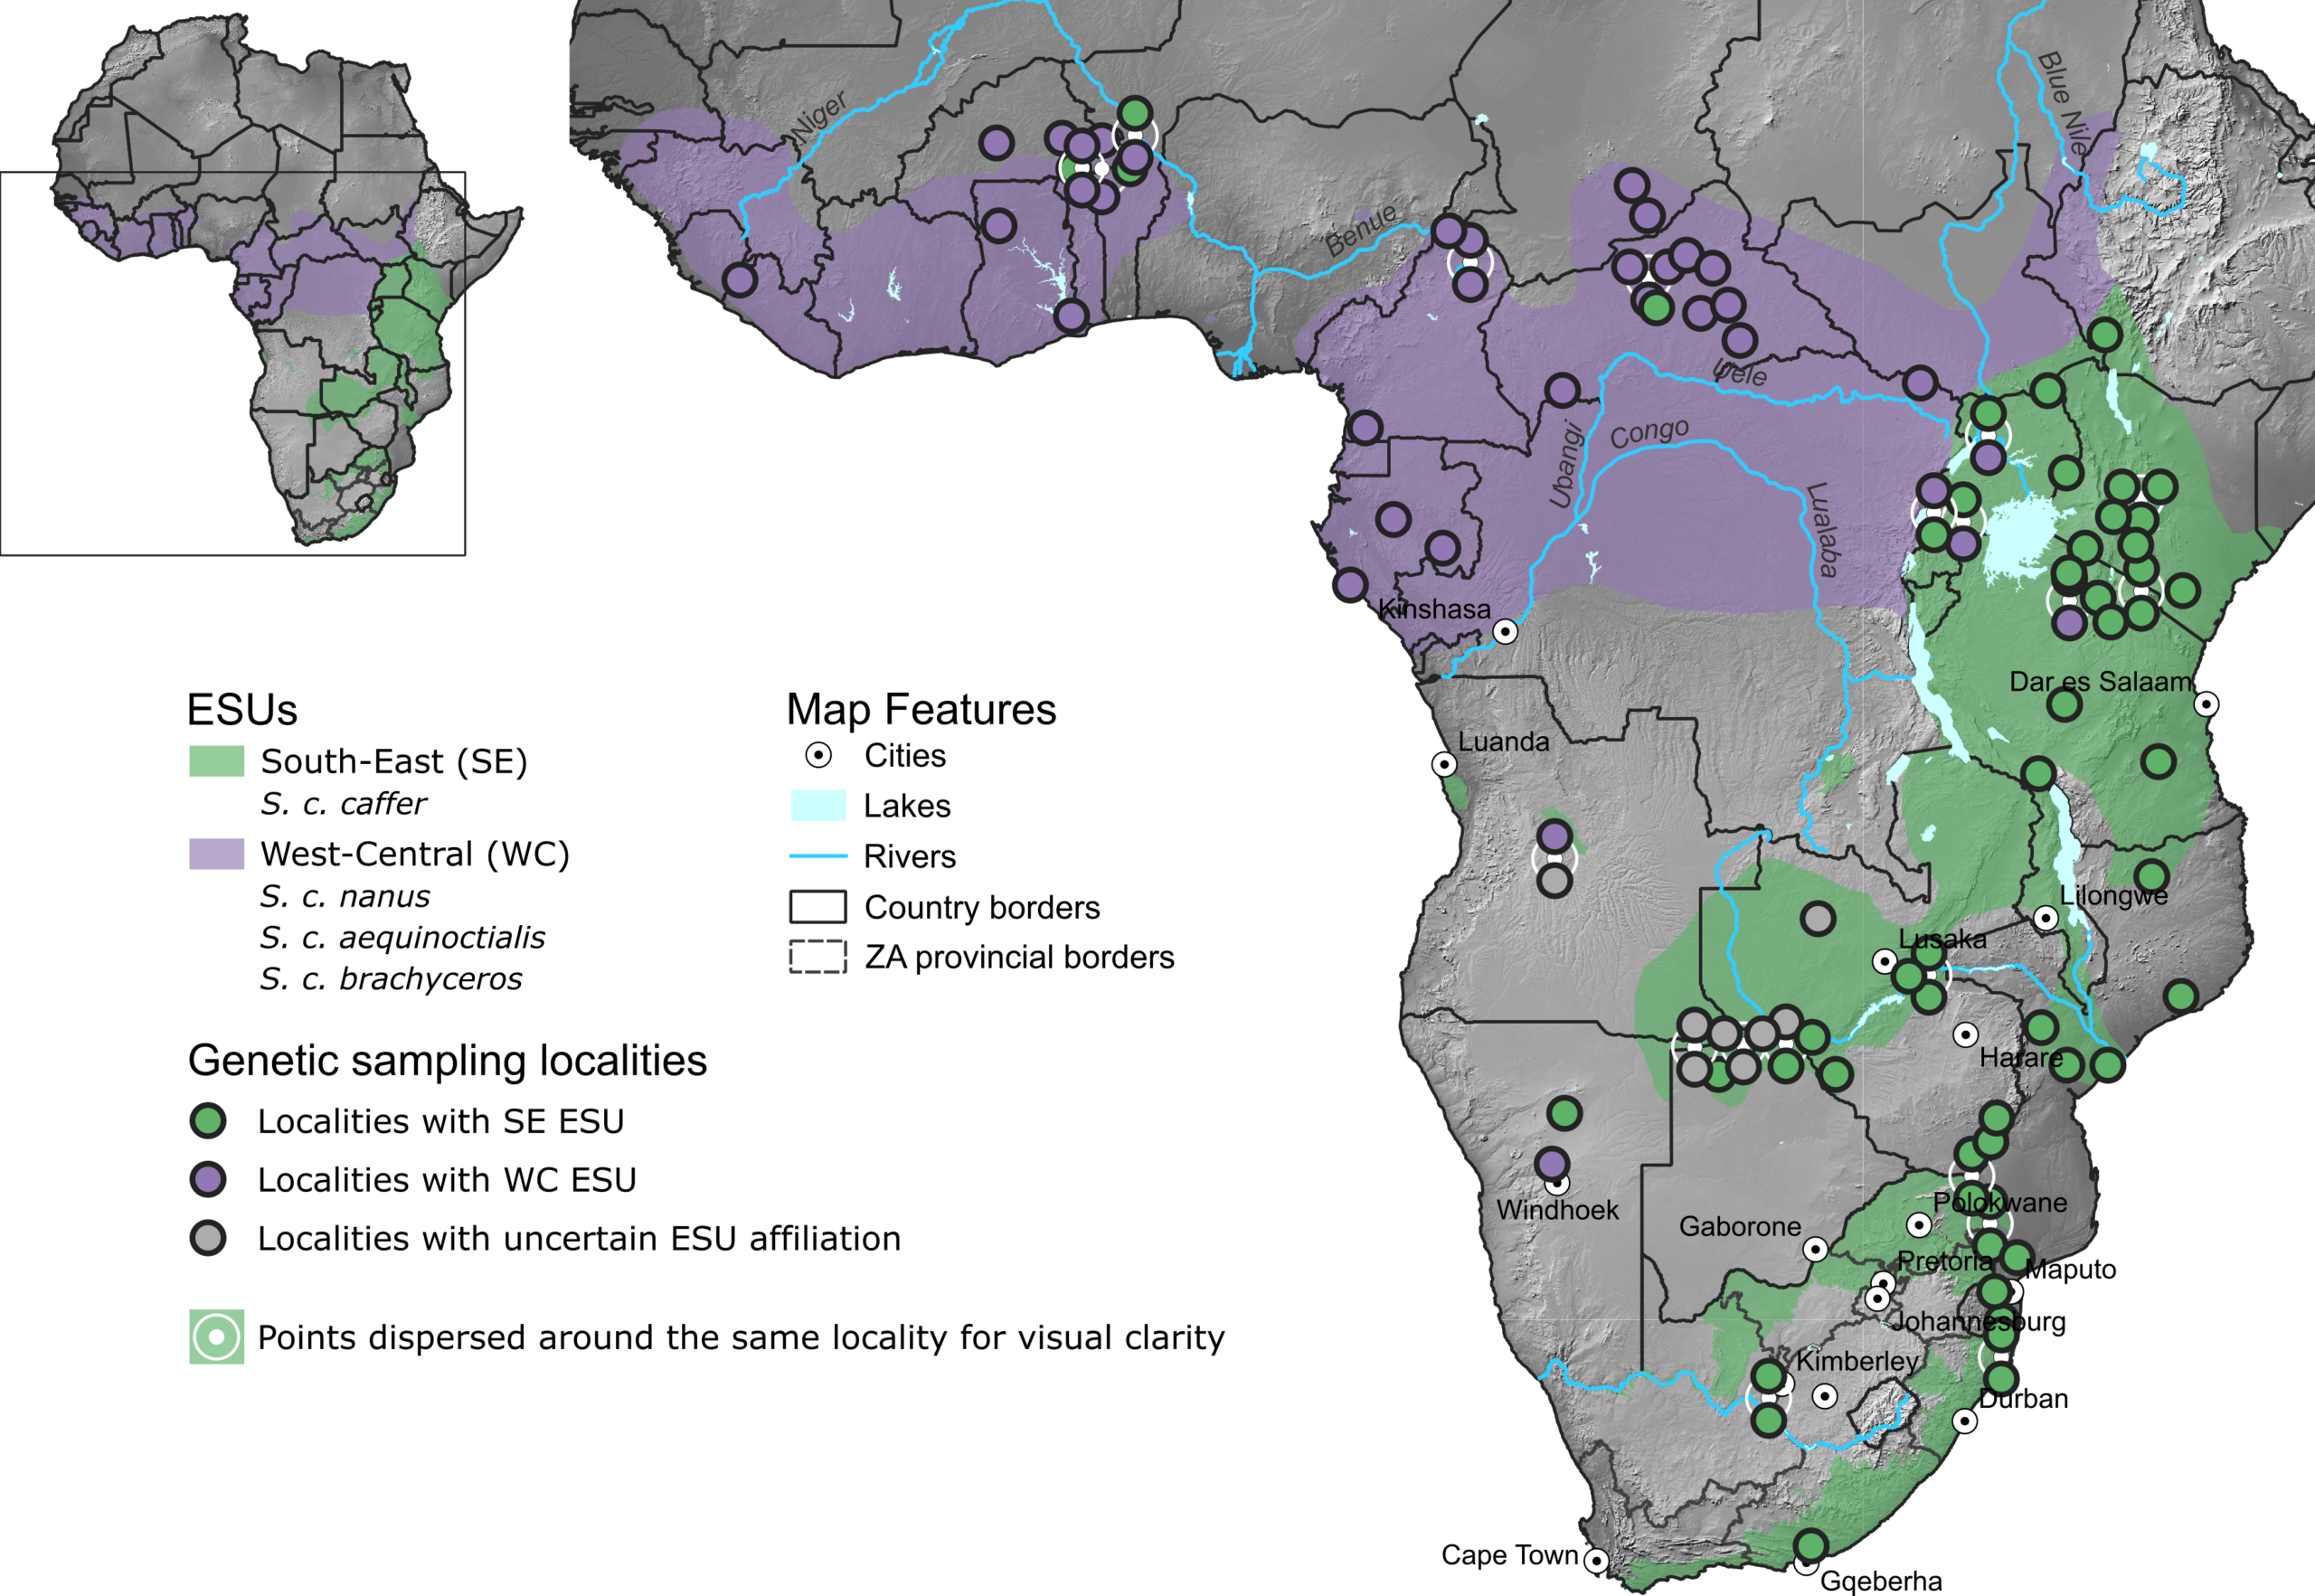
Figure 1: Natural distribution of African buffalo (Syncerus caffer) ESUs, indicated by different colours. Each point represents a locality which has been sampled for genetic data, with the colour corresponding to the ESU or ESUs present at that locality. Note that both ESUs are indicated in some localities. This may seem unexpected, but can be due to several reasons: First, it may be due to incomplete lineage sorting and with more evolutionary time the genetic distribution of the ESUs will become more distinct. Second, it may be due to limited data being available from these localities (a short fragment of the mitochondrial control region) and the analysis the ESU designation is based on (i.e. haplotype networks in Smitz et al. (2013) and de Jager et al. (2025)). Additional data from these samples (e.g. whole mitochondrial genomes or nuclear genome data) might result in their ESU designation becoming more harmonious with the ESU distribution. Third, the localities might be a natural contact zone between the two ESUs and thus might represent a hybrid zone. This is particularly relevant for the localities in Uganda. Grey dots indicate localities/samples which have uncertain ESU affiliation due to only nuclear data (no mitochondrial data) being analyzed in a local context (i.e. no comparative populations were included from elsewhere), thus not making it possible to confidently assign their ESU affiliation from their geographic location. These localities are clustered in south-western Africa (Angola, Namibia, Zambia), where there is evidence that the WC ESU occurred naturally based on the mitochondrial control region (van Hooft et al. 2002; Smitz et al. 2013). Thus, with limited context for their nuclear data and no mitochondrial data, their ESU affiliation remains uncertain until this can be specifically tested with additional data. Distribution data sources: South Africa and eSwatini – Birss, C., Rushworth, I., Collins, N. B., Peinke, D. & Buijs, D. 2017. Inferred natural distribution ranges of certain large mammals in South Africa. Unpublished GIS coverage. Rest of Africa – IUCN (International Union for Conservation of Nature) 2008. Syncerus caffer. The IUCN Red List of Threatened Species. Version 2020-1. https://www.iucnredlist.org.

Management Level

Subspecies

Four subspecies of African buffalo are described based on morphological characteristics.

  • Syncerus caffer caffer (Cape buffalo)
  • Syncerus caffer nanus (Forest buffalo)
  • Syncerus caffer brachyceros (Sudan buffalo)
  • Syncerus caffer aequinoctialis (Nile buffalo)

However, the guidelines provided in this document are based on genetic data translated into the Evolutionarily Significant Units (ESUs) and Genetic Management Units (GMUs) listed below.

Evolutionarily Significant Units (ESUs)
  • West-Central (WC) (S. c. nanus, S. c. brachyceros and S. c. aequinoctialis)
  • South-East (SE) (S. c. caffer)
Genetic Management Units (GMUs)
  • West-Central (WC)
    • No GMUs are recognised at present due to lack of appropriate data.
  • South-East (SE)
    • Functionally, East African and southern African populations should be considered as different GMUs due to the vast distances between them. But given the gradual increase in differentiation with distance (i.e. the isolation-by-distance pattern of genetic variation), it is difficult to define distinct GMU boundaries and thus we do not do so here. See the management  guidelines for more details.

Additionally, some individual populations require special attention in terms of genetic management, due to being threatened by inbreeding, or because they already contain a non-ideal mixture of buffalo from different sources. See the management guidelines for more details.

Management boundaries

See Figure 1 for visual representation and figure legend for more detail.
Evolutionarily Significant Units (ESUs)
  • West-Central (WC) (S. c. nanus, S. c. brachyceros and S. c. aequinoctialis): Central to West Africa, potentially including south-western Africa. 
  • South-East (SE) (S. c. caffer): East Africa to southern Africa. 
Genetic Management Units (GMUs)
  • West-Central ESU: None defined at present.
  • South-East ESU: None defined at present, though some populations require specific considerations (see management guidelines).

Genetic Risk

  • Global population Nc: 398,000-401,000 (IUCN 2019).
  • South African population Nc: 48,917 (Venter et al. 2025).
  • Genetic indicators are calculated at ESU level. This is based on a best case scenario where gene flow is maintained within ESUs. However, the SE ESU does show potential isolation-by-distance, and therefore GMUs may be present that have yet to be defined (Talenti et al. 2024).
  • If values are reported as a range, the average is used for subsequent calculations.
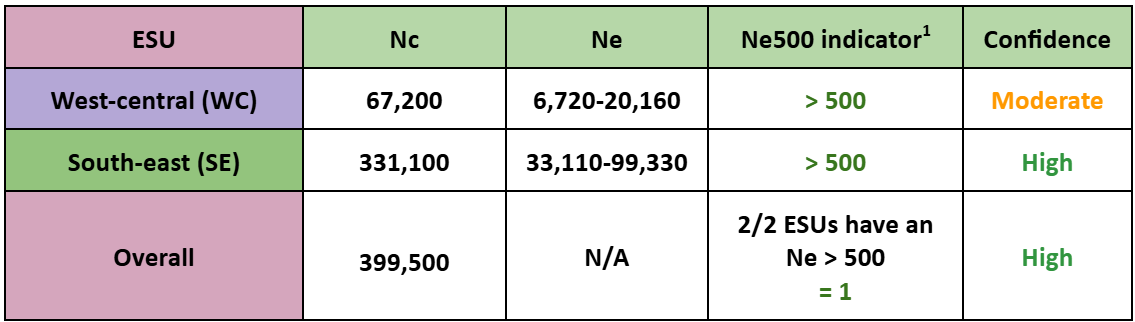
Table 1. Effective population size, Ne500 indicator, and confidence in the values calculated per ESU for African buffalo. Colour of the ESU label is linked to the colour used in Figure 1. Colour of Ne500 and confidence text corresponds to positive (green) or negative  interpretation (orange/red). Overall Ne500 indicates the proportion of the total ESUs that have an Ne over 500.
Genetic Indicators
  • Ne500 indicator1
    • Western Central (WC) individuals: 96,000 (Cornelis et al. 2014). With assumed maturity percentage of 70 % (Venter et al. 2025; IUCN 2019), Nc: 67,200. Using an Nc:Ne ratio of 0.1-0.3, Ne = 6,720-20,160.
    • South-east (SE) individuals: 473,000 (Cornelis et al. 2014). With assumed maturity percentage of 70 % (Venter et al. 2025; IUCN 2019), Nc: 331,100. Using an Nc:Ne ratio of 0.1-0.3, Ne = 33,110-99,330.

Both ESUs have an Ne above 500 which indicates each will maintain genetic diversity, assuming gene flow is maintained, thus indicating lower genetic risk.

  • Proportion of populations maintained (PM2):
    • The global populations of African buffalo comprise 2 ESUs, therefore the proportion of populations maintained globally: 2/2 = 1.
Diversity Loss
  • Functional variation: There is some risk of functional variation loss in S. caffer due to having areas of fragmented or isolated population due to human agriculture and disease control (Venter et al. 2025). Trophy hunting in natural populations that target breeding males may lead to unintentional changes in gene frequencies in the population (genetic drift). Only males older than 10 years (thus, past their breeding prime) should be targeted for trophy hunting. Addo Elephant NP, Mokala NP, Waterberg Plateau NP, and private ranches are generally free from major bovid diseases (bovine tuberculosis, foot-and-mouth disease and theileriosis). These disease-free populations of Cape buffalo (S. c. caffer) represent an “insurance policy” for the South-East ESU, in the event that a disease outbreak causes major population declines in southern Africa.
  • Divergent lineages: There is moderate risk of losing divergent lineages as both ESUs have seen population decline in mature individuals in recent decades with an overall loss of 18% between 1999 and 2014 (East 1999; Cornalis et al. 2014). The subspecies S. c. aequinoctialis has seen the most decline, with a drop of 61% documented in the same time period (East 1999; Cornalis et al. 2014). Addo Elephant NP harbours an unique, highly divergent mitochondrial lineage (de Jager et al. 2025), which is threatened by the high inbreeding levels in this population.
Hybridisation/introgression
  • There is no major risk to genetic structure through hybridisation between ESUs as rates are low and within restricted geography; detected instances appear to be natural or historic.
  • Natural contact zones within the range between ESUs may be facilitating hybridisation, especially for localities in Uganda (See figure 1). Intermediate individuals that may be hybrids between S. c. nanus and S. c. aequinoctialis (Talenti et al. (2024).
Lower turnover/constraints on adaptive opportunities
  • There is a high risk of constraints on adaptive potential, especially in isolated populations, as effective population sizes have substantially declined across much of the buffalo’s range (Talenti et al. 2024). Human mediated translocation and selective breeding may have a negative impact on African buffalo populations’ ability to adapt via narrowing of the gene pool and creating fragmented populations (de Jager et al. 2020). Additionally, disease resilience may also be limited locally through populations facing natural selection from bovine tuberculosis and foot-and-mouth disease (Lane-deGraff et al. 2016). In Mozambique and other regions such as parts of South Africa, high levels of genome-wide homozygosity and reduced genetic variation have been documented (Colangelo et al. 2024; Talenti et al. 2024; Quinn et al. 2023; de Jager et al. 2021). African buffalo populations seem to be particularly prone to strong genetic drift when isolated from other populations, leading to a loss of genetic variation and eventually inbreeding and inbreeding depression. This is illustrated by an increasing number of studies and populations (see Population-specific guidelines above).
In situ genetic threat level
  • In situ risk (High)
    African buffalo exist in fragmented populations, and have evidence of inbreeding and low heterozygosity within populations. Despite both ESUs having an Ne well above 500, there is decline seen in numbers of mature individuals and several threats to genomic diversity, including selective breeding, disease, and trophy hunting, put the species at risk. For more threats, see the IUCN Red List and South African Red List.


  • Confidence in in situ threat level
    • Confidence score (High)

Confidence is high as the assessment is based on regional assessment data published within the last year (Venter et al. 2025) and overall species range assessment from the last decade (IUCN 2019). Genetic risk evaluation has been based on numerous studies from within the last six years across the species range (Colangelo et al. 2024; de Jager et al. 2020; Talenti et al. 2024; Quinn et al. 2023). Population numbers may not be entirely accurate due to the nature of surveying migratory species, however confidence can be had in the ESUs Ne500 indicator results.
Ex situ representation
  • The African buffalo is found in 59 institutions across 24 countries, with a total of 463 individuals in captivity, the majority being within Europe (IUCN 2019).
  • Knowledge of genetics in ex situ populations outside of Africa is limited.
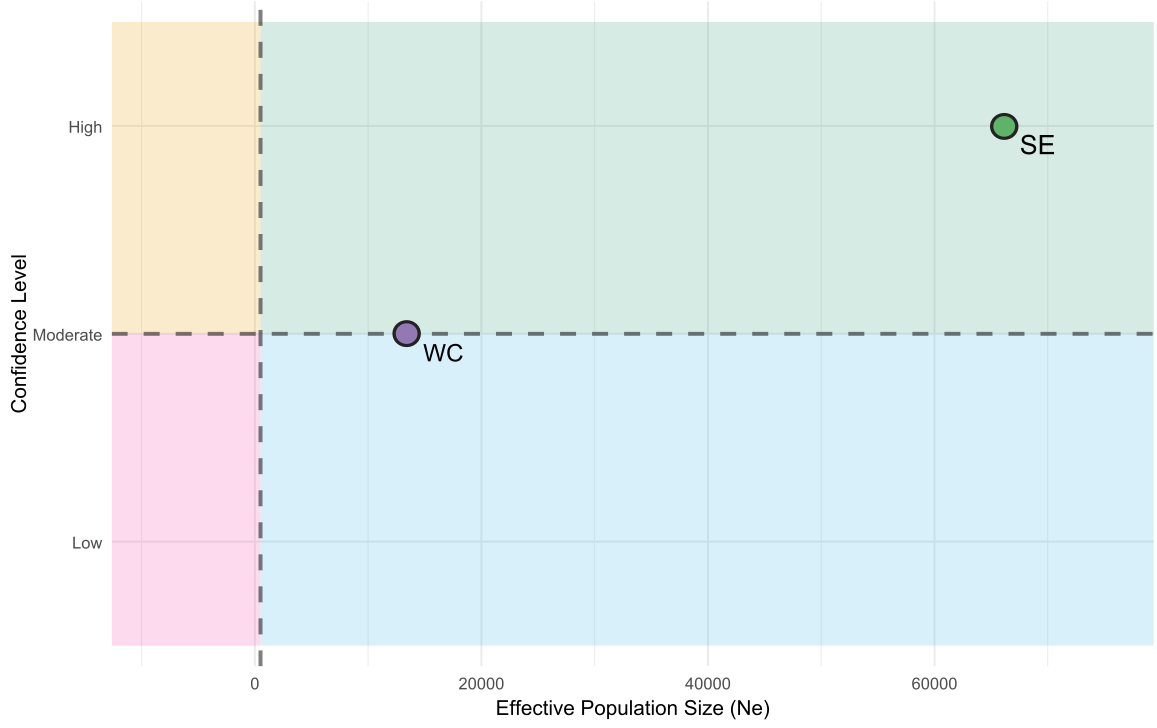
Figure 2. Effective population size compared to confidence in the value. Colour of points and labelling corresponds to the ESU in Figure 1 and Table 1. Dashed lines divide the x axis into above and below Ne500, and the y axis into low and high confidence. ESUs in the low confidence quadrant should be further surveyed to increase confidence in the evaluation. Those with high confidence below Ne500 should have increased genetic management.

1 Proportion of populations within species with an effective population size (Ne) greater than 500
(https://www.gbf-indicators.org/metadata/headline/A-4)

2 Proportion of populations maintained within species
(https://ccgenetics.github.io/guidelines-genetic-diversity-indicators/docs/2_Theoretical_background/PM-indicator.html)

Management Guidelines

  • No introductions of West-Central ESU into the range of the South-East ESU, and vice versa.
  • South-East (SE)
    • No translocations directly from East Africa to southern Africa, and vice versa.
    • Translocations should instead follow a step-wise pattern between neighbouring or nearby populations to mimic the natural isolation-by-distance pattern of genetic differentiation.
    • Promote natural migration/gene flow between populations where possible.
  • Both ESUs within the species have an Ne > 500 under the assumption of gene flow. Therefore, management must strive to facilitate natural migration and gene flow between isolated populations, while taking cognisance of the other guidelines above.

Population-specific guidelines

  • South Africa:
    • Addo Elephant NP: Genetic supplementation is required due to high levels of inbreeding (O’Ryan et al., 1998, de Jager et al., 2020, 2021, Quinn et al., 2023) and thus to prevent inbreeding depression. Due to strict disease control regulations and with Addo Elephant NP being a disease-free population, the most appropriate source population is Mokala NP, which harbours disease-free Kruger NP buffalo. One buffalo bull should be translocated per buffalo generation (every ~7.5 years) (O’Ryan et al., 1998). Note that Addo Elephant NP contains unique mitochondrial DNA diversity (de Jager et al. 2025) and thus only bulls (males) should be introduced, as they do not pass on mitochondrial DNA and thus the unique mitochondrial diversity of Addo will be retained.
    • Hluhluwe-iMfolozi Park: Similar to Addo Elephant NP, although inbreeding is less severe in this population (de Jager et al., 2021, Quinn et al., 2023). Thus, introducing one buffalo bull every 1-2 buffalo generations (7.5-15 years) might be sufficient to prevent inbreeding depression. The most appropriate genetic source would be buffalo of Kruger NP origin due to their geographic proximity and high genetic diversity. Southern Mozambique (e.g. Namaacha or Catuane) is another potential source, though populations studied in this region also have low genetic diversity and high inbreeding levels, which risks introducing novel deleterious alleles into the population (Colangelo et al., 2024). See priority research for more on this.
    • Private ranches: No translocation of buffalo from private ranches to national parks/natural populations of buffalo in southern Africa should occur, unless no other appropriate source population is available, as per the guidelines under South-East ESU above. While many populations/herds were established with disease-free Addo Elephant NP buffalo, and later Kruger NP-origin buffalo from Mokala NP were also introduced (de Jager et al., 2020), it is well-known that buffalo of East African origin have also been introduced into the South African private ranch system. This breaks down the evolutionarily-established pattern of isolation-by-distance and is in opposition to the first guideline under South-East ESU above. Consequently, the private ranch buffalo population network should be considered as a separate system and a last resort for conservation translocations/reintroductions/introductions.

    Mozambique:

    • Catuane, Namaacha, Marromeu National Reserve, and Gorongosa NP: While Smitz et al. (2014) did not observe particularly low genetic diversity in Mozambique populations using microsatellites (including Marromeu and Gorongosa), Colangelo et al. (2024) observe alarmingly low levels of diversity and high levels of inbreeding in the above-mentioned populations using more powerful markers (genomic SNPs). Thus, these populations require urgent genetic supplementation to prevent inbreeding depression. The most appropriate source population depends on the geographic location of the receiving population, with buffalo of Kruger NP origin likely an appropriate source for the southern and central Mozambique populations due to their high diversity and geographic proximity. However, caution must be taken not to genetically swamp these native Mozambican populations with Kruger buffalo. Thus, introducing 1-2 Kruger NP bulls per generation (~7.5 years) should be sufficient. Hluhluwe-iMfolozi Park might be another appropriate source for the southern populations, but as with the converse scenario, Colangelo et al. (2024) caution that careful genomic studies are required prior to translocation between two populations with low diversity to prevent the introduction of additional deleterious genetic variants. See Priority research for more on this.

    Namibia:

    • Waterberg Plateau NP: This is an introduced population north of Windhoek (green dot on the map in Figure 1), with source buffalo from Addo Elephant NP and potentially East Africa via a Namibian game dealer (de Jager et al., 2020). While predominantly showing a genetic signature of Addo Elephant NP, another genetic cluster is present, as with private ranches in South Africa (de Jager et al., 2020). Thus, this population should be considered as part of the private ranch network and the same guidelines apply.
    • Additionally, Namibia may also naturally harbour the WC ESU, as indicated by the purple dot at Okahandja, near Windhoek. The sample linked to this location, with a WC ESU mitochondrial control region haplotype, was sourced from the Antwerpen Zoo (Belgium), but its mother was from Okahandja and father from Windhoek. Given that mitochondrial DNA is passed only from mother to offspring, it suggests that the WC ESU may have occurred naturally in Namibia, assuming that its mother naturally occurred around Okahandja and was not introduced there.
    • Zambezi Region (previously Caprivi Strip): These populations have only been studied with nuclear data in a local context (Epps et al., 2013), but they may represent a historical contact zone between the SE and WC ESUs. Thus, they are here designated as having an uncertain ESU affiliation until further studies are conducted (e.g. mitochondrial DNA studies, or nuclear DNA studies with other SE or WC ESU populations included).

    Zambia:

    • Simalaha Conservancy (near Mwandi): Buffalo were introduced from Waterberg Plateau NP (Namibia) (Pers. Comm. R. D. Taylor 2021). Thus, it should be treated as part of the private ranch system. Ideally, this population should have been established with buffalo from the nearby Chobe NP (Botswana), or from the Zambezi Region (previously Caprivi Strip) (Namibia). Thus, the same guidelines as for Waterberg Plateau NP and private ranches in South Africa apply to this population.
    • The location with uncertain ESU affiliation in south-west Zambia is due to a lack of mitochondrial data in Smitz et al. (2014) where this sample was only studied in a local context with microsatellite data. However, this region might represent a contact zone between the WC and SE ESUs. The GPS location of this sample is unknown and was approximated from the map in Smitz et al. (2014).

    Angola:

    • Very little data are available from Angola, with potentially only one sample analyzed, as it is unclear whether Smitz et al. (2014) genotyped the same sample with microsatellites as van Hooft et al. (2002) sequenced at the mitochondrial control region. The latter showed that the sample harboured a WC ESU mitochondrial haplotype (van Hooft et al., 2002, de Jager et al., 2025), while the microsatellite data was not analyzed in a broad enough context to make an ESU designation, hence the uncertain ESU designation as well. Note that the location of the Angolan samples are unknown, and thus the centroid of the country was used. The sample from van Hooft et al. (2002) was from the Dresden Zoo (Germany), but its great-grandmother was from Angola and with mitochondrial DNA being passed down to offspring only along the maternal line, this suggests that the WC ESU was/is present in Angola. This is also supported by the reporting of a “dwarf-buffalo-like” population in Angola based on morphology (Smitz et al., 2013 cite Prins 1996), suggesting that south-western Africa, potentially including Namibia and Zambia (or parts thereof) represented a link between the WC and SE ESUs.

IUCN Status:

  • Global: Near threatened (indicated below).
  • South Africa: Least concern. 

Limitations & Assumptions

  • Translocations of buffalo from East to southern African private ranches, and from private ranches to other National Parks and Reserves have already complicated interpretation of natural genetic patterns.

Priority Research

  • Sample natural populations in Angola, Namibia, and Zambia (or museum specimens representing these populations). Both mitochondrial and nuclear data should be generated and analyzed in a broad context (i.e. with both SE and WC ESU reference samples) to determine their ESU affiliation. This region may represent an historical contact zone between the WC and SE ESUs.
  • A comprehensive study of African buffalo across the continent is required, combining both nuclear and mitochondrial data, to facilitate direct comparisons of genetic diversity and structure. While many genetic studies have been conducted on African buffalo, they have used different combinations of data and populations, each with their own limitations. For example, the study by Talenti et al. (2024) was the most comprehensive to date (195 whole genome sequences from all four subspecies, representing both ESUs), but lacked mitochondrial data, which can provide valuable insights into phylogeography. By combining the genomic data from de Jager et al. (2021), Quinn et al. (2023), Colangelo et al. (2024), and Talenti et al. (2024), such a comprehensive study should be possible and will be highly informative for these guidelines and other management initiatives.
  • With reference to Hluhluwe-iMfolozi Park (South Africa) and the southern Mozambique populations from Colangelo et al. (2024) (e.g. Namaacha and Catuane), a genomic study comparing runs-of-homozygosity (ROHs) between these populations could be informative regarding whether it is appropriate to exchange individuals between them. If there is a large overlap in the location of ROHs within the genomes of individuals from these populations and the genetic variants within ROHs between populations are the same, then genetic exchange would do little to boost the genetic diversity of either population. However, if the location of ROHs in the genome are, to a large extent, complementary and/or the genetic variants within ROHs are different between the populations, then genetic exchange should be beneficial to both populations, as new genetic variation is then introduced.

Cited References

  • Colangelo, P. et al. (2024). Genome-wide diversity, population structure and signatures of inbreeding in the African buffalo in Mozambique. BMC Ecology and Evolution, 24(1), 29. doi.org/10.1186/s12862-024-02209-2.
  • de Jager, D. et al. (2020). Genetic diversity, relatedness and inbreeding of ranched and fragmented Cape buffalo populations in southern Africa. PLoS One 15, e0236717. doi.org/10.1371/journal.pone.0236717.
  • de Jager, D. et al. (2021). High diversity, inbreeding and a dynamic Pleistocene demographic history revealed by African buffalo genomes. Scientific Reports 11, 4540. doi.org/10.1038/s41598-021-83823-8.
  • de Jager, D. et al. (2025). A Highly Divergent Mitochondrial Genome in Extant Cape Buffalo From Addo Elephant National Park, South Africa. Ecology and Evolution, 15(1), e70640. doi.org/10.1002/ece3.70640
  • Epps, C. W., Castillo, J. A., Schmidt-Küntzel, A., Preez, P. d., Stuart-Hill, G., Jago, M., & Naidoo, R. (2013). Contrasting historical and recent gene flow among African buffalo herds in the Caprivi strip of Namibia. Journal of Heredity, 104(2), 172-181. https://doi.org/10.1093/jhered/ess142.
  • Lane-deGraaf, K.E., Amish, S.J., Gardipee, F. et al. Signatures of natural and unnatural selection: evidence from an immune system gene in African buffalo. Conserv Genet 16, 289–300 (2015). https://doi.org/10.1007/s10592-014-0658-0 
  • O’Ryan, C. et al. (1998). Microsatellite analysis of genetic diversity in fragmented South African buffalo populations. Animal Conservation 1, 85-94. doi.org/10.1111/j.1469-1795.1998.tb00015.x.
  • Quinn, L. et al. (2023). Colonialism in South Africa leaves a lasting legacy of reduced genetic diversity in Cape buffalo. Molecular Ecology, 32(8), 1860-1874. doi.org/10.1111/mec.16851.
  • Russo, I.-R. M., Hoban, S., Bloomer, P., Kotzé, A., Segelbacher, G., Rushworth, I., Birss, C., & Bruford, M. W. (2019). ‘Intentional Genetic Manipulation’ as a conservation threat [journal article]. Conservation Genetics Resources, 11(2), 237-247. https://doi.org/10.1007/s12686-018-0983-6
  • Simonsen, B. T. et al. (1998). Population structure of African buffalo inferred from mtDNA sequences and microsatellite loci: High variation but low differentiation. Molecular Ecology 7, 225-237. doi.org/10.1046/j.1365-294x.1998.00343.x.
  • Smitz, N. et al. (2014). Genetic structure of fragmented southern populations of African Cape buffalo (Syncerus caffer caffer). BMC Evolutionary Biology 14, 203-222. doi.org/10.1186/s12862-014-0203-2.
  • Smitz, N. et al. (2013). Pan-African genetic structure in the African buffalo Syncerus caffer: Investigating intraspecific divergence. PLoS One 8, e56235. doi.org/10.1371/journal.pone.0056235.
  • Talenti, A. et al. (2024). Continent-wide genomic analysis of the African buffalo (Syncerus caffer). Communications Biology, 7(1), 792. doi.org/10.1038/s42003-024-06481-2.
  • van Hooft, W. F., Groen, A. F., & Prins, H. H. T. (2002). Phylogeography of the African buffalo based on mitochondrial and Y-chromosomal loci: Pleistocene origin and population expansion of the Cape buffalo subspecies. Molecular Ecology, 11(2), 267-279. https://doi.org/10.1046/j.1365-294X.2002.01429.x.
  • van Hooft, W. F. et al. (2000). Microsatellite analysis of genetic diversity in African buffalo (Syncerus caffer) populations throughout Africa. Molecular Ecology 9, 2017-2025. doi.org/10.1046/j.1365-294X.2000.01101.x.
  • Venter J, Russo IM and da Silva JM. 2025. A conservation assessment of Syncerus caffer caffer. In Patel T, Smith C, Roxburgh L, da Silva JM & Raimondo D, editors. The Red List of Mammals of South Africa, Eswatini and Lesotho. South African National Biodiversity Institute and Endangered Wildlife Trust, South Africa.
  • Wurster, D. H., & Benirschke, K. (1968). Chromosome studies in the superfamily Bovoidea. Chromosoma, 25(2), 152-171. https://doi.org/10.1007/bf00327175


Additional References

  • Ernest, E. M., Haanes, H., Bitanyi, S., Fyumagwa, R. D., Msoffe, P. L., Bjørnstad, G., & Røed, K. H. (2012). Influence of habitat fragmentation on the genetic structure of large mammals: Evidence for increased structuring of African buffalo (Syncerus caffer) within the Serengeti ecosystem. Conservation Genetics, 13(2), 381-391. https://doi.org/10.1007/s10592-011-0291-0.
  • Glanzmann, B., Möller, M., le Roex, N., Tromp, G., Hoal, E. G., & van Helden, P. D. (2016). The complete genome sequence of the African buffalo (Syncerus caffer). BMC Genomics, 17(1), 1001. https://doi.org/10.1186/s12864-016-3364-0.
  • Greyling, B. J. (2007). Genetic variation, structure and dispersal among Cape buffalo populations from the Hluhluwe-Imfolozi and Kruger National Parks of South Africa [PhD thesis, University of Pretoria]. Pretoria, South Africa.
  • Grobler, J. P., & Van Der Bank, F. H. (1996). Genetic diversity and isolation in African Buffalo (Syncerus caffer). Biochemical Systematics and Ecology, 24(7), 757-761. https://doi.org/10.1016/S0305-1978(96)00078-6.
  • Heller, R., Brüniche-Olsen, A., & Siegismund, H. R. (2012). Cape buffalo mitogenomics reveals a Holocene shift in the African human–megafauna dynamics. Molecular Ecology, 21(16), 3947-3959. https://doi.org/10.1111/j.1365-294X.2012.05671.x.
  • Heller, R., Lorenzen, E. D., Okello, J. B. A., Masembe, C., & Siegismund, H. R. (2008). Mid-Holocene decline in African buffalos inferred from Bayesian coalescent-based analyses of microsatellites and mitochondrial DNA. Molecular Ecology, 17(22), 4845-4858. https://doi.org/10.1111/j.1365-294X.2008.03961.x.
  • Heller, R., Okello, J. B. A., & Siegismund, H. (2010). Can small wildlife conservancies maintain genetically stable populations of large mammals? Evidence for increased genetic drift in geographically restricted populations of Cape buffalo in East Africa. Molecular Ecology, 19(7), 1324-1334. https://doi.org/10.1111/j.1365-294X.2010.04589.x.
  • van Hooft, W. F., Groen, A. F., & Prins, H. H. T. (2003). Genetic structure of African buffalo herds based on variation at the mitochondrial D-loop and autosomal microsatellite loci: Evidence for male-biased gene flow. Conservation Genetics, 4(4), 467-477. https://doi.org/10.1023/A:1024719231545.
  • Venter J, Russo IM & da Silva JM. 2025. A conservation assessment of Syncerus caffer caffer. In Patel T, Smith C, Roxburgh L, da Silva JM & Raimondo D, editors. The Red List of Mammals of South Africa, Eswatini and Lesotho. South African National Biodiversity Institute and Endangered Wildlife Trust, South Africa.
  • Prins, H. H. T. (1996). Ecology and behaviour of the African buffalo: social inequality and decision making. Wildlife Ecology and Behaviour Series (Vol. 1). Chapman & Hall. London.


Appendix

Extended Background

The African buffalo (Syncerus caffer) is one of the African ungulates that has been the most intensively studied from a genetic perspective. Studies have ranged from cytogenetics to elucidate the number of chromosomes of subspecies, to genes and variants associated with disease status, to allozymes, microsatellites, mitochondrial DNA, single nucleotide polymorphisms, and whole-genome data used to investigate the genetic diversity within and relationships between populations and subspecies across the continent. Within S. caffer, four subspecies described based on morphological characteristics have generally been accepted, namely S. c. caffer (Cape or Savannah buffalo – large, blackish, large horns), S. c. nanus (forest or dwarf buffalo – small, reddish/brown, small horns), S. c. brachyceros (Sudan buffalo – intermediate size and colour compared to Cape and forest buffalo), and S. c. aequinoctialis (Nile buffalo – intermediate size and colour compared to Cape and forest buffalo) (see Smitz et al. 2013 for a summary of morphological differences). 

All genetic studies that have included samples from all four proposed subspecies have found little evidence to support these classifications, instead finding evidence for only two lineages: a West-Central lineage consisting of forest, Sudan, and Nile buffalo (S. c. nanus, S. c. brachyceros, and S. c. aequinoctialis) and South-East lineage consisting of Cape buffalo only (S. c. caffer) (van Hooft et al. 2002, Smitz et al. 2013, Talenti et al. 2024). While there is some shared genetic variation between these two broad lineages, this assessment has defined them as two distinct Evolutionarily Significant Units (ESUs) – the WC and SE ESUs. This is based on the combined evidence of (i) high genetic differentiation between them (FCT mitochondrial DNA = 0.42 – 0.48 (van Hooft et al. 2002, Smitz et al. 2013), mean FST genome-wide data = 0.13 (Talenti et al. 2024)), (ii) distinct number of chromosomes (2n = 52 for Cape buffalo and 2n = 54 for forest buffalo (Wurster & Benirschke, 1968)), and (iii) substantial morphological differences and ecological niches of the WC lineage and SE lineage buffalo.

Within the WC ESU, limited genetic studies have been done on individual populations and the genetic relationships between them. In general, there is high diversity within this ESU (van Hooft et al. 2000, 2002, Smitz et al. 2013). However, Talenti et al. (2024) found evidence of inbreeding (FROH ~ 0.25) in the forest buffalo population in the Lekedi region of Gabon, although this was only based on two samples. More genetic studies are required for this ESU.

Within the SE ESU (Cape buffalo), the overarching genetic pattern, that has repeatedly been found with different genetic markers, that is driving genetic structure between populations from East to southern Africa is one of isolation-by-distance (Simonsen et al. 1998, van Hooft et al. 2000, van Hooft et al. 2002, Talenti et al. 2024). In other words, there is/was high gene flow between neighbouring populations, but populations further apart geographically are more distinct genetically due to no direct gene flow between these populations (e.g. East Africa and southern Africa). Interestingly, Quinn et al. (2023) did not find this exact isolation-by-distance pattern, but rather found support for a scenario where East African populations and southern African populations form two separate clades that diverged around 49-77 thousand years ago, with subsequent (but ancient) gene flow from the eastern to the southern clade. This finding further supports the management guidelines here that buffalo should not be translocated between east and southern Africa. In general, most Cape buffalo populations (SE ESU) also have high genetic diversity – a result of them being historically connected such that gene flow restored diversity that may have been lost due to past bottlenecks.

Fine-scale genetic structure has, however, also been identified between populations in southern Africa, which was not driven by isolation-by-distance, but rather by a combination of climatic events over the last 6,000 years and human expansion, pastoralism, and hunting over the last ~2,000 years (Smitz et al. 2014). This highlights the complexities that studies using different genetic markers, and sampling at different scales can bring, and it is unclear what patterns may have been found if populations from East Africa were included in Smitz et al. (2014). Nonetheless, there was high gene flow between the clusters identified in this study, some of which was driven by recent translocations from northern to southern Zimbabwe. Thus, while the broad pattern of genetic variation is isolation-by-distance, there may be different forces working at more local scales (such as arid zones between populations) that should be considered when making management/translocation decisions.

However, there are several populations that are notable exceptions to this broad pattern of high genetic diversity and gene flow with neighbouring populations, instead exhibiting low genetic diversity and high levels of inbreeding. These populations experienced massive population declines in the recent past (i.e. the last ~300 years) due to human activities (e.g. hunting, conflict) and diseases (e.g. rinderpest), and were subsequently isolated from other populations due to further human activities (habitat destruction, infrastructure, fences, etc.). Thus, while other populations recovered genetically by re-establishing gene flow with nearby populations (e.g. Kruger National Park; van Hooft et al. 2000), the post-bottleneck isolation of the populations in question has resulted in them being genetically depauperate and threatened with inbreeding depression. The currently known genetically threatened populations are Addo Elephant National Park and Hluhluwe-iMfolozi Park in South Africa (O’Ryan et al. 1998, Smitz et al. 2014, de Jager et al. 2020, de Jager et al. 2021, Quinn et al. 2023, Talenti et al. 2024), and Catuane, Namaacha, Marromeu National Reserve, and Gorongosa National Park in Mozambique (Colangelo et al. 2024). These populations require urgent genetic supplementation and highlight the vulnerability of Cape buffalo populations to genetic threats as a result of isolation from other populations.

Consultation

Acknowledgements

We are grateful to Drs Nathalie Smitz and Russell Taylor for their valuable comments and for taking the necessary time and effort to critically review the initial guidelines. 

Queries

If you have any additional questions related to these guidelines, please contact ConGen Africa at info@congenafrica.com.

Explore other species