ConGen Africa

GENETIC MANAGEMENT GUIDELINES

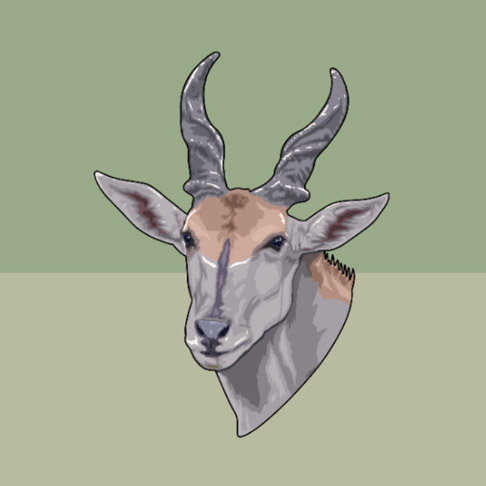
Common Eland Tragelaphus oryx

A single species of the common eland Tragelaphus oryx (Pallas 1766) is currently recognised across the southern and East African parts of the geographic range. This species name is synonymous with the former Taurotragus oryx. For permitting purposes in southern Africa, Namibia and South Africa currently utilise Tragelaphus oryx. There is dispute about the number of subspecies; this assessment adopted morphological and genetic evidence of distinction between two forms, providing the basis for the recognition of two Genetic Management Units (GMUs). Figure 1 illustrates the geographic distribution of these GMUs and also indicates localities where natural contact zones appear to exist between them. The validity of the third lineage requires priority research.
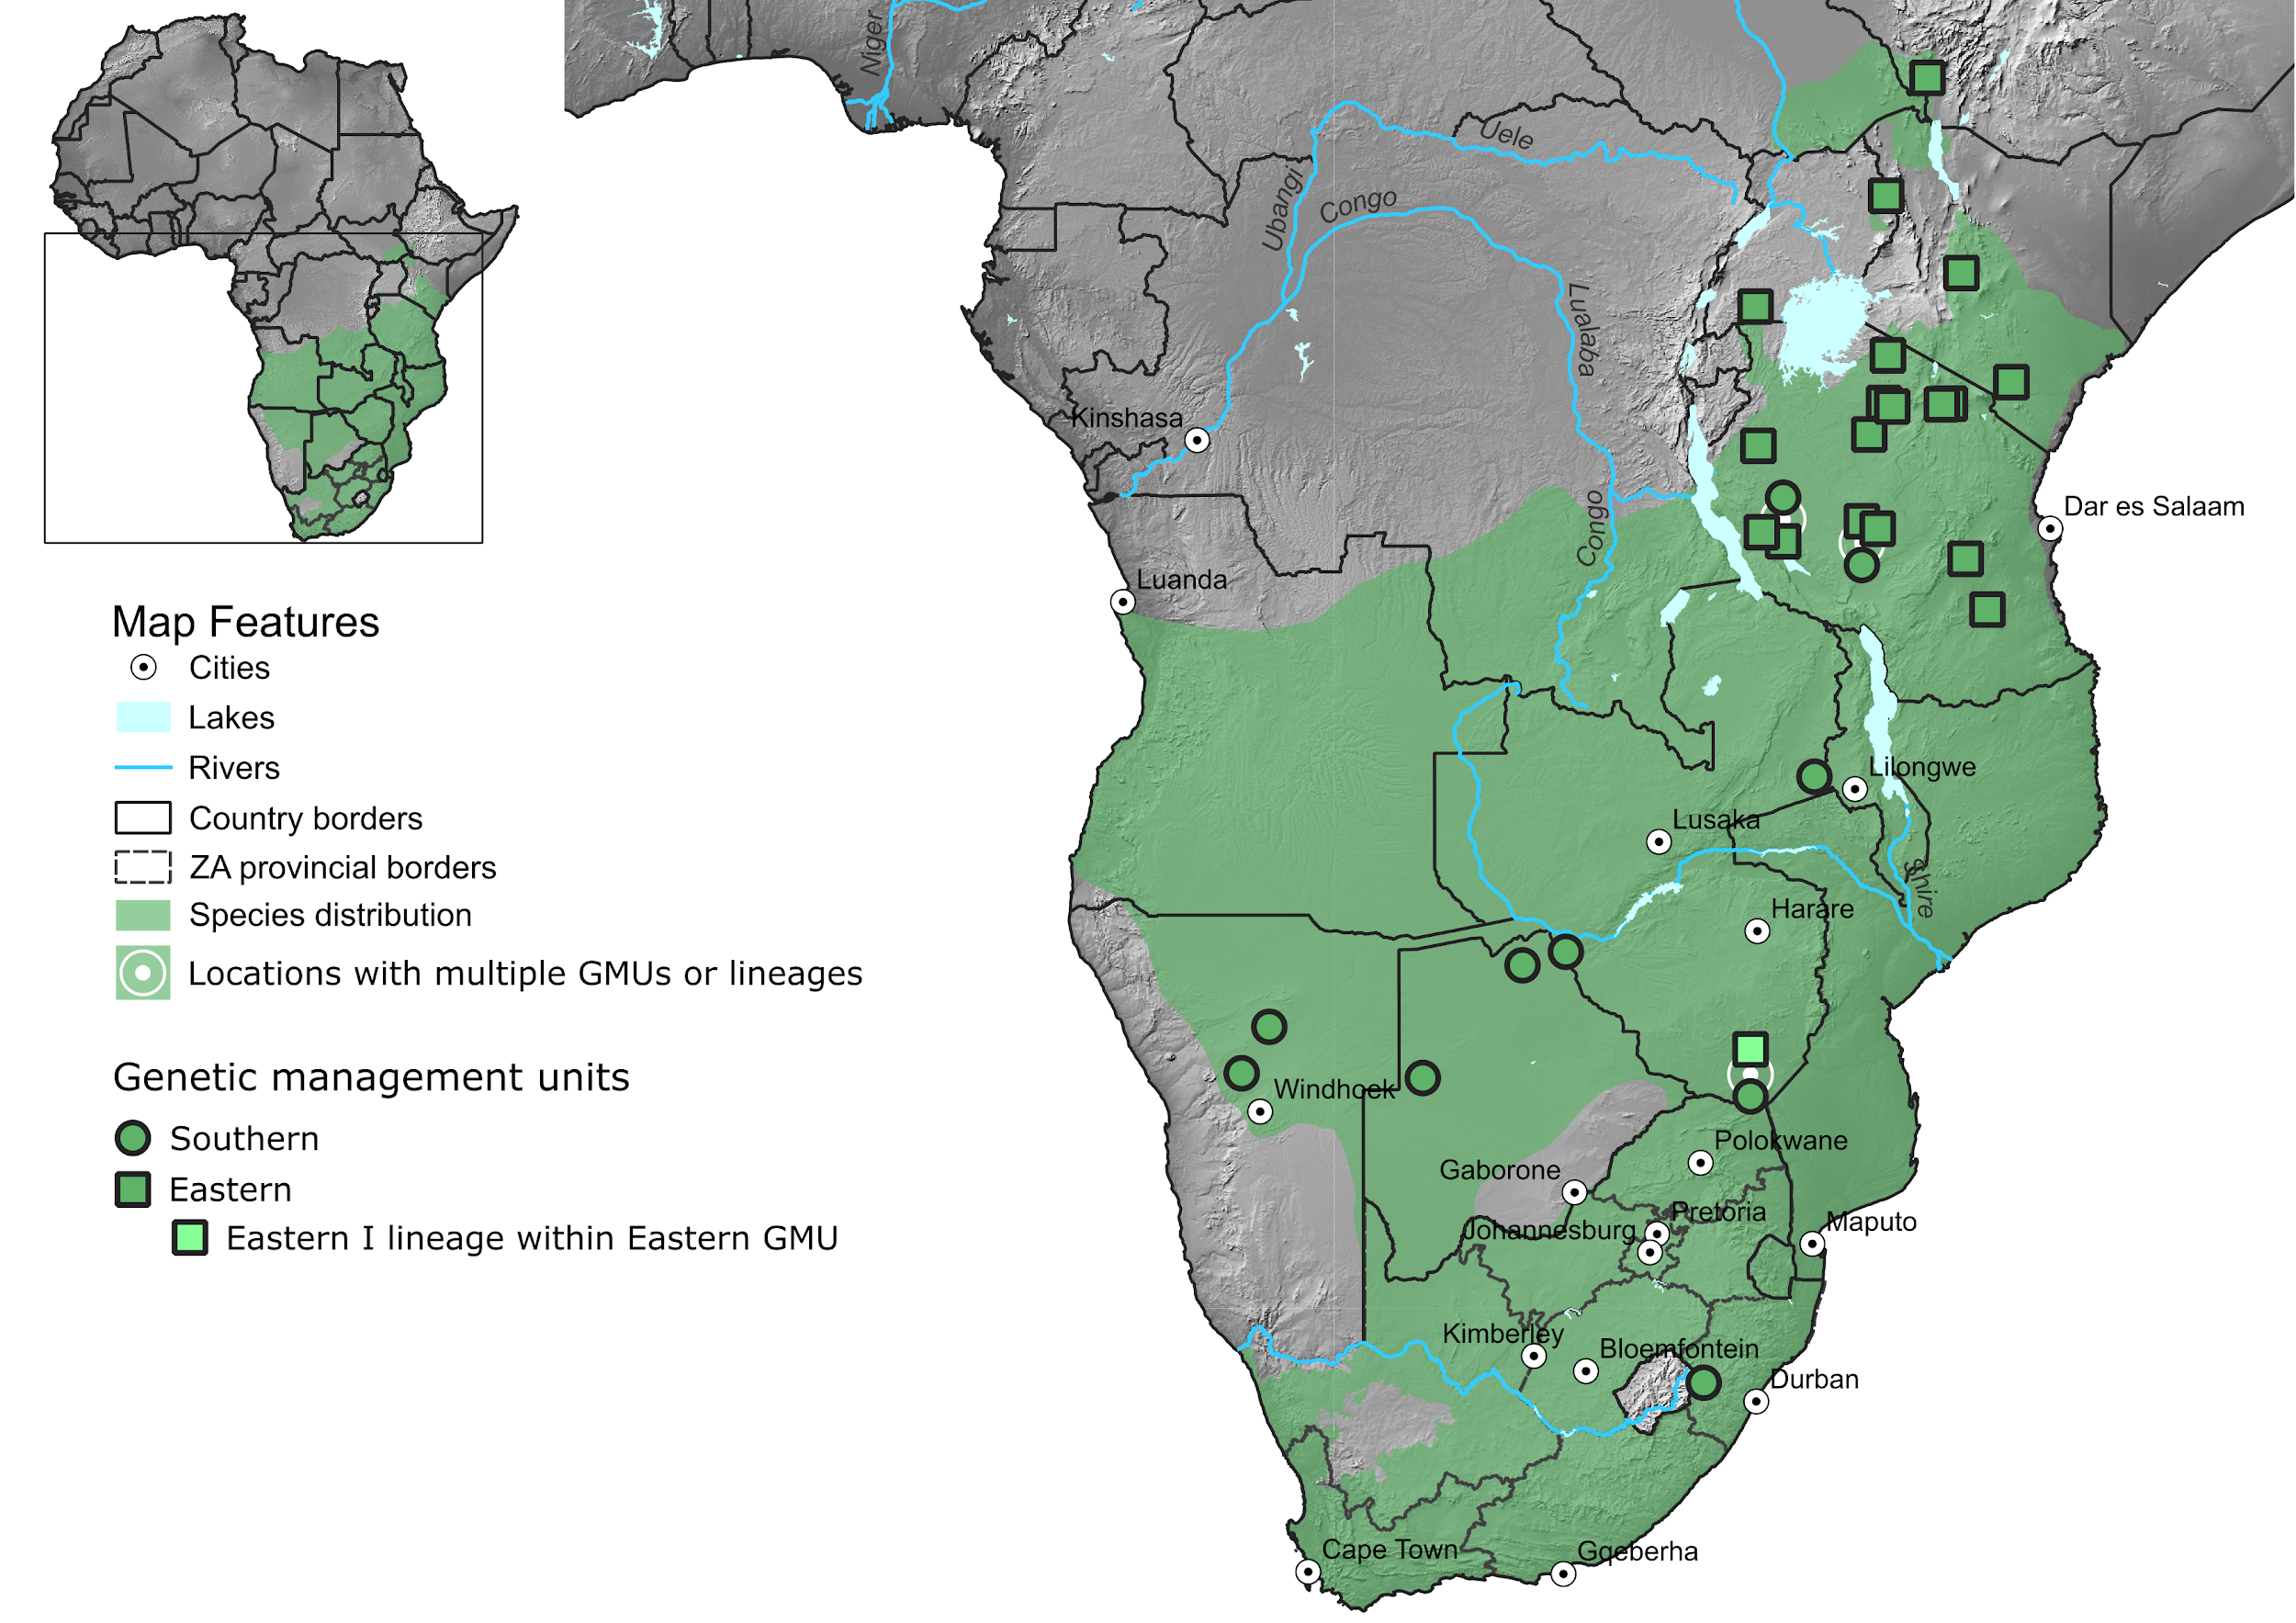
Figure 1: Natural distribution of common eland (Tragelaphus oryx) in green shading. Genetic Management Units (GMUs) are indicated by different symbols. Each point represents a locality which has been sampled for genetic data and thus the GMU (symbol) designation of each locality is based on genetic data. Note two localities in eastern Africa with both the Eastern and Southern GMUs present (Lungwa and Mlele, Tanzania). The Eastern I lineage (=”Intermediate” lineage from Lorenzen et al. 2010) within the Eastern GMU is shown in light green and is presently known to occur at Nuanetsi, Zimbabwe together with individuals that fall within the Southern GMU lineage. The inset indicates the part of Africa shown in the main map. Distribution data sources: South Africa – Birss, C., Rushworth, I., Collins, N. B., Peinke, D. & Buijs, D. 2017. Inferred natural distribution ranges of certain large mammals in South Africa. Unpublished GIS coverage. Rest of Africa – IUCN (International Union for Conservation of Nature) 2008. Tragelaphus oryx. The IUCN Red List of Threatened Species. Version 2021-1. https://www.iucnredlist.org.

Management Level

Subspecies

Three subspecies have been suggested, based on morphological characteristics (Ansell 1972), although their exact characteristics and distribution are unclear and their classification is disputed (Thouless 2013; Buys et al. 2016; IUCN 2016).

  • Tragelaphus oryx oryx (Cape eland, Pallas 1766): South Africa, Namibia, southern Botswana, south-western Zimbabwe.
  • Tragelaphus oryx livingstonii (Livingstone’s eland, P.L. Sclater, 1864): Angola, northern Namibia, northern Botswana, Zimbabwe, Mozambique, Zambia, southern DRC, Malawi.
  • Tragelaphus oryx pattersonianus (Patterson’s or East African eland, Lydekker 1906): Tanzania, Rwanda, Burundi, Uganda, Kenya, southern South Sudan, southern Ethiopia.
     

However, the guidelines provided in this document are based on genetic data translated into the Evolutionarily Significant Units (ESUs) and Genetic Management Units (MUs) listed below.

Evolutionarily Significant Units (ESUs)

No ESUs are recognised at present (but see Priority Research).

Genetic Management Units (GMUs)
  • Eastern (EE)
  • Southern (SO)
  • Central (CE); tentative, referred to as “intermediate” by Lorenzen et al. (2010)

Management Boundaries

See Figure 1 for visual representation. Text descriptions follow.

Genetic Management Units (GMUs, based on genetic data from Lorenzen et al. (2010))
  • Eastern (EE): South Sudan, Ethiopia, Uganda, Rwanda, Burundi, Kenya, Tanzania.
  • Southern (SO): Zambia, Zimbabwe, Botswana, Namibia, Angola, South Africa, Mozambique.
  • Central (CE): Southern Zimbabwe 

Genetic Risk:

There are three subspecies currently recognised for this species, but their validity remains disputed. For this evaluation, genetic management units were used.

  • Global population Nc: 90,000-110,000 (IUCN 2016).
  • South African population Nc: 34,925-45,648 (Venter and da Silva 2025).
  • Genetic indicators are calculated at GMU level. This is based on a best case scenario where gene flow is maintained within GMUs.
  • If values are reported as a range, the average is used for subsequent calculations.

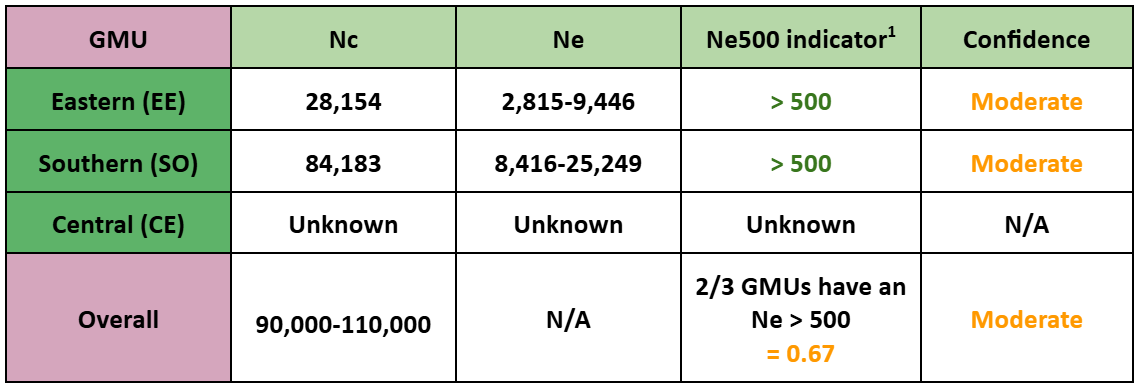
Table 1. Effective population size, Ne500 indicator, and confidence in the values calculated per GMU for common eland. The colour of the GMU label is linked to the colour used in Figure 1. Colour of Ne500 and confidence text corresponds to positive (green) or negative interpretation (orange/red). Overall Ne500 indicates the proportion of the total GMUs that have an Ne over 500.
Genetic indicators
  • Ne500 indicator1:
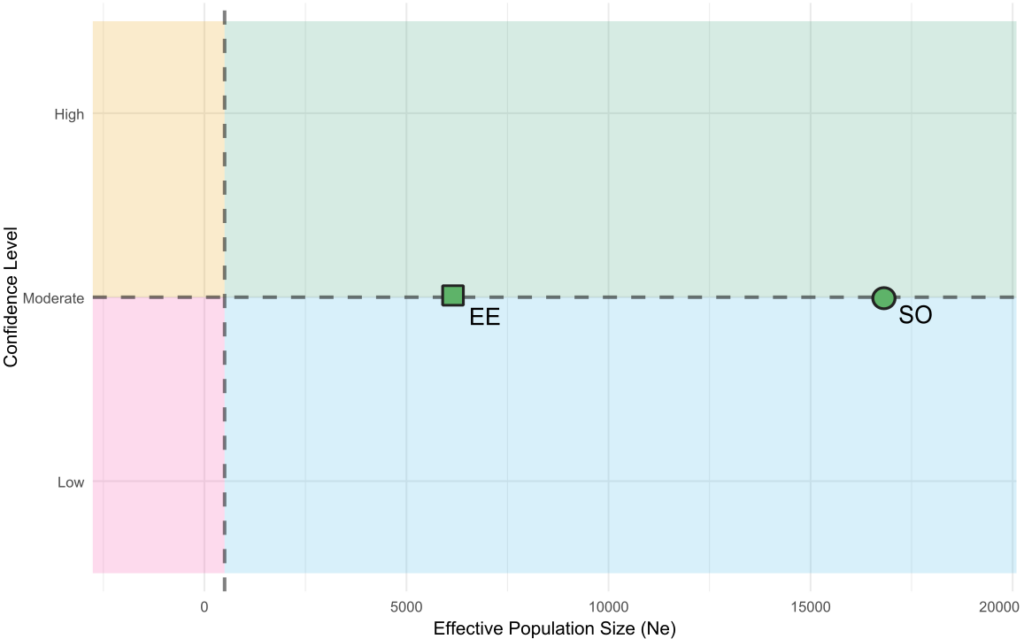
    • Eastern (EE) individuals: > 40,220 (East 1999). With assumed maturity percentage of 70 % (Buijs et al. 2016), Nc: 28,154. Using an Nc:Ne ratio of 0.1-0.3, Ne = 2,815-9,446.
    • Southern (SO) Nc: 84,163 (East 1999; Venter and da Silva 2025). Using an Nc:Ne ratio of 0.1-0.3, Ne = 8,416-25,249.
    • Central (CE) Nc: Unknown.

Eastern and southern management units have an Ne above 500 which indicates each GMU will maintain genetic diversity, assuming gene flow is maintained within GMUs, thus indicating lower genetic risk. The central GMU lacks sufficient data to evaluate.

  • Proportion of populations maintained (PM2)
    • The global populations of the common eland comprise three GMUs, therefore the proportion of populations maintained globally: 3/3 = 1.
Diversity loss
  • Functional variation: There is risk of functional variation loss due to increasingly fragmented, intensively managed populations that are often admixed or bred in small founder groups. Due to this, there has likely been a loss of traits that were adapted to specific habitats. 
  • Divergent lineages: There is little risk of losing current divergent lineages due to high effective population numbers for EE and SO GMUs. The CE GMU is the most at risk as is a much smaller group.
Hybridisation/Introgression
  • There is little risk of hybridisation for common eland with other closely related species.  There have been cases of eland hybridisation with greater kudu, however this was only in captivity with rare circumstances and the offspring was sterile (Jorge et al. 1976). No introgression has been seen in genetic studies of eland (Kubatova et al. 2020). 
  • Crosses between GMUs within common eland are a more pressing risk as once individuals of another GMU are introduced, hybridisation is highly likely to occur. Eland can jump over game fences (>2 m high) with relative ease and are highly mobile and nomadic. This increases the probability of escape and consequent hybridisation of out-of-range animals with local, natural populations (e.g. Eastern GMU on southern African farms, or “Livingstone’s” phenotype in the range of the “Cape” phenotype). 
Lower turnover/constraints on adaptive opportunities
  • Founder effects in subpopulations within managed areas and translocation without consideration for unique genetic groups pose risk to adaptive potential.
In situ genetic threat level
  • In situ Risk (Low)

Common eland exist in small, fragmented populations, however eastern and southern genetic management units have an Ne well above 500 and are relatively stable, therefore with facilitation of gene flow between populations within GMUs, risk is low (IUCN 2016; Buijs et al. 2016). More data is needed on the central GMU to comment. For more threats, see the IUCN Red List and South African Red List.

  • Confidence in in situ threat level
    • Confidence score (Moderate)

Confidence is moderate as the assessment is based on IUCN or regional assessment  data from within the last decade (IUCN 2016; Buijs et al. 2016; Venter and da Silva 2025). However, population numbers per GMU to calculate Ne500 were assumed from data provided in East (1999) as well as the South African red list assessment (Buijs et al. 2016; Venter and da Silva 2025) and the population is assumed to have remained stable (IUCN 2016). The in situ risk score is based on several assumptions and could potentially misrepresent current population census sizes and change interpretations. 
Ex situ representation
  •  Common eland exists in captive populations within southern Africa, particularly South Africa. Many of these are game ranches outside of their natural range (IUCN 2016).
  • Globally, they are found in 148 institutions across 46 countries (within North Central, and South America, Europe, Asia, and Africa).
  • Hybridisation between the GMUs in captive populations may be widespread.
Figure 2. Effective population size compared to confidence in the value. Colour and shape of points and labelling corresponds to the GMU in Figure 1 and Table 1. Dashed lines divide the x axis into above and below Ne500, and the y axis into low and high confidence. GMUs in the low confidence quadrant should be further surveyed to increase confidence in the evaluation. Those with high confidence below Ne500 should have increased genetic management. Note that the CE GMU is not shown due to data deficiency.

1Proportion of populations within species with an effective population size (Ne) greater than 500

(https://www.gbf-indicators.org/metadata/headline/A-4

2Proportion of populations maintained within species

(https://ccgenetics.github.io/guidelines-genetic-diversity-indicators/docs/2_Theoretical_background/PM-indicator.html)

Genetic Management Units (GMUs)

Management Guidelines

  • Allow migration between GMUs at natural “contact zones”. For example, between Zambian and Tanzanian populations.
  • No translocations of individuals from countries containing the Eastern GMU into countries containing the Southern GMU, and vice-versa. 
  • As far as possible, manage “Cape” and “Livingstone’s” phenotypes within the Southern GMU separately. See Priority research for short descriptions of these phenotypes.
  • The “Livingstone’s” eland phenotype in the Southern GMU is challenging to distinguish from the “East African” eland phenotype in the Eastern GMU (number of stripes and coat colour). Therefore, captive bred animals, and those on private ranches, must be genetically tested before release to ensure no inadvertent introductions of the Eastern GMU into the range of the Southern GMU occurs. 
  • Both GMUs have Ne > 500 under the assumption of gene flow within GMUs. Therefore, management must strive to facilitate natural migration and gene flow between isolated populations within each GMU, while taking cognisance of the other guidelines above.

IUCN Status:

  • Global: Least concern (indicated below).
  • South Africa: Least concern. 

Limitations & Assumptions

  • It is assumed that the phenotypic differences between “Cape” and “Livingstone’s” have an ecological function, and potentially an underlying genetic cause. Hence, the recommendation to manage them separately. 
  • Only mitochondrial data are currently available (Lorenzen et al. 2010), which may not show the full picture. Recommendations may change when new data are generated. At least two studies using nuclear data are currently underway in this species. 
  • Eland on private ranches may be a mix of GMUs and/or phenotypes.
  • There is some evidence that eland in the Eastern GMU are 50% grazers, while eland in the Southern GMU are predominantly browsers (Gagnon & Chew 2000). 

Priority Research

  • Further studies are required to investigate the cause/s and function/s of phenotypic variation within the Southern GMU. Two distinct phenotypes exist, which were originally used as support to classify and distinguish two subspecies (not currently supported by genetic data, see Frost 2014):
    • “Cape” eland ( T. o. oryx): Dull fawn in colour, with no white stripes, typically found from the southern tip of Africa, extending northwards to the southern parts of Botswana and northern Namibia and south-western Zimbabwe.
    • “Livingstone’s” eland ( T. o. livingstonii): Rufous-fawn in colour, with thin white stripes down their flanks and a dark brown mark on the back of the forelegs just above the knee. Typically found in north-eastern Namibia, Angola, northern Botswana, Zimbabwe, Zambia, Mozambique, Malawi, and the southern Democratic Republic of the Congo.
  • The distribution and origin of the Southern Central lineage (equivalent to the “intermediate” lineage from Lorenzen et al. 2010) within the Southern GMU, but overlapping with the range of the Eastern GMU, should be investigated to further elucidate its relationship to the Southern and Eastern GMUs.
  • Range-wide genetic studies using nuclear data are required for each GMU to investigate genetic structure.
  • Kruger National Park (South Africa), Mozambique, Zambia and Malawi must be sampled more extensively to obtain a clearer picture of the phylogeography within the species. There may be additional “contact zones” between the two GMUs in Malawi, Zambia and the north of Mozambique. 

Cited References

  • Setzer, H. W., & Meester, J. (1971). The mammals of Africa: an identification manual. Smithsonian Institution Washington, 1-15.
  • Buijs D, Venter JA, Parrini F, Relton C. Initials. 2016. A conservation assessment of Tragelaphus oryx. In Child MF, Roxburgh L, Do Linh San E, Raimondo D, Davies-Mostert HT, editors. The Red List of Mammals of South Africa, Swaziland and Lesotho. South African National Biodiversity Institute and Endangered Wildlife Trust, South Africa.
  • Buys, D. et al. (2016) A conservation assessment of Tragelaphus oryx. In: M.F., Child, L.  Roxburgh, E. Do Linh San, D. Raimondo D & H.T. Davies-Mostert (eds). The Red List of Mammals of South Africa, Swaziland and Lesotho. South African National Biodiversity Institute and Endangered Wildlife Trust, South Africa. https://speciesstatus.sanbi.org/assessment/last-assessment/2254/.
  • Gagnon, M. & Chew, A.E. (2000). Dietary preferences in extant African Bovidae. Journal of Mammalogy 81, 490-511. https://www.jstor.org/stable/1383406.
  • Frost, W. (2014). The Antelope of Africa. T. Carnaby (ed), Jacana Media, Auckland Park, South Africa. 78-81.
  • IUCN SSC Antelope Specialist Group. 2016. Tragelaphus oryx (errata version published in 2017). The IUCN Red List of Threatened Species 2016: e.T22055A115166135. doi.org/10.2305/IUCN.UK.2016-3.RLTS.T22055A50196938.en. Accessed on 09 March 2025.
  • W. Jorge, Sandra Butler, K. Benirschke, Studies on a male eland × kudu hybrid, Journal of Reproduction and Fertility, Volume 46, Issue 1, 1 January 1976, Pages 13–16, https://doi.org/10.1530/jrf.0.0460013 
  • Kubátová, A., Štochlová, K., Brandlová, K. et al. Comparison of divergent breeding management strategies in two species of semi-captive eland in Senegal. Sci Rep 10, 8841 (2020). https://doi.org/10.1038/s41598-020-65598-6
  • Lorenzen, E. D. et al. (2010). A long-standing Pleistocene refugium in southern Africa and a mosaic of refugia in East Africa: Insights from mtDNA and the common eland antelope. Journal of Biogeography 37, 571-581. doi.org/10.1111/j.1365-2699.2009.02207.x.
  • Thouless, C. R. (2013). Tragelaphus oryx. In: J. S. Kingdon and M. Hoffmann (eds), The Mammals of Africa, Academic Press, Amsterdam, The Netherlands.
  • Venter, J. and da Silva, J.M. 2025. A conservation assessment of Tragelaphus oryx. In Patel T, Smith C, Roxburgh L, da Silva JM & Raimondo D, editors. The Red List of Mammals of South Africa, Eswatini and Lesotho. South African National Biodiversity Institute and Endangered Wildlife Trust, South Africa. 

Consultation

  • IUCN SSC Conservation Genetics Specialist Group
  • IUCN SSC Antelope Specialist Group

Acknowledgements

We are grateful to Prof Eline Lozenzen and Dr Frans Radloff for their valuable comments and for taking the necessary time and effort to critically review the initial guidelines.

Queries

If you have any additional questions related to these guidelines, please contact ConGen Africa at info@congenafrica.com.

Explore other species